Geçen hafta, Hürmüz Boğazı krizindeki dramatik tırmanışın etkisiyle şekillendi; bu durum, önceki Cuma günü piyasaları kısa süreliğine yükselten temkinli iyimserliği tersine çevirdi. ABD-İran ateşkesi - süresiz olarak uzatılmış olsa da - diplomatik bir ilerleme sağlamadı: ABD Donanması Hint Okyanusu’nda bir İran süpertankerine el koydu, Başkan Trump kuvvetlere boğazdaki mayın döşeyen gemileri hedef alma emri verdi ve Tahran, limanlarına yönelik deniz ablukası sürdüğü sürece müzakereye istekli olmadığını belirtti. Bu gelişmeler Brent petrolünü hafta boyunca yaklaşık %14 yükselterek enflasyon endişelerini yeniden alevlendirdi ve altın ile gümüş gibi getiri sağlamayan varlıklar üzerinde kalıcı baskı oluşturdu. ABD doları güvenli liman akımlarıyla güçlenirken, euro ve kıymetli metaller de bundan olumsuz etkilendi.
Bununla birlikte, piyasalar haftayı daha umutlu bir notla tamamladı. Cuma öğleden sonra, ABD Özel Temsilcisi Steve Witkoff ve Jared Kushner'ın cumartesi günü İranlı muhataplarla doğrudan görüşmeler için Pakistan'a gideceği doğrulandı ve İran Dışişleri Bakanı Araghchi'nin de İslamabad ve Maskat'ı ziyaret edeceğini açıkladığı bildirildi. Piyasalar buna gözle görülür bir rahatlamayla tepki verdi: petrol gün içi zirvelerinden geriledi, S&P 500 ve Nasdaq Cuma günü tüm zamanların en yüksek seviyelerinde kapandı ve EUR/USD toparlanarak 1.1720'nin üzerinde kapanış yaptı. Bitcoin ve diğer riskli varlıklar da istikrar kazandı. Bu diplomatik ivmenin somut bir Hürmüz çözümüne dönüşüp dönüşmeyeceği, yeni işlem haftasının açılışında belirleyici soru olacak.
Önümüzdeki hafta son derece yoğun veri ve olay gündemine sahip ve tüm büyük varlık sınıfları için kritik olabilir. Öne çıkan olaylar şunlar: FOMC faiz kararı (28-29 Nisan); faizlerin oybirliğiyle %3.50-3.75 aralığında sabit tutulması bekleniyor - odak tamamen Powell’ın enflasyon ve faiz indirimi patikasına ilişkin söyleminde olacak; ABD 1. çeyrek GSYH (30 Nisan); ECB para politikası toplantısı (30 Nisan); Euro Bölgesi TÜFE ve GSYH öncü tahminleri; ve ABD Tarım Dışı İstihdam (1 Mayıs). Pakistan’daki ABD-İran doğrudan görüşmelerinin sonucu, pazartesi seansı açılırken petrol, enflasyon beklentileri ve genel risk iştahı için tonu belirleyecek.
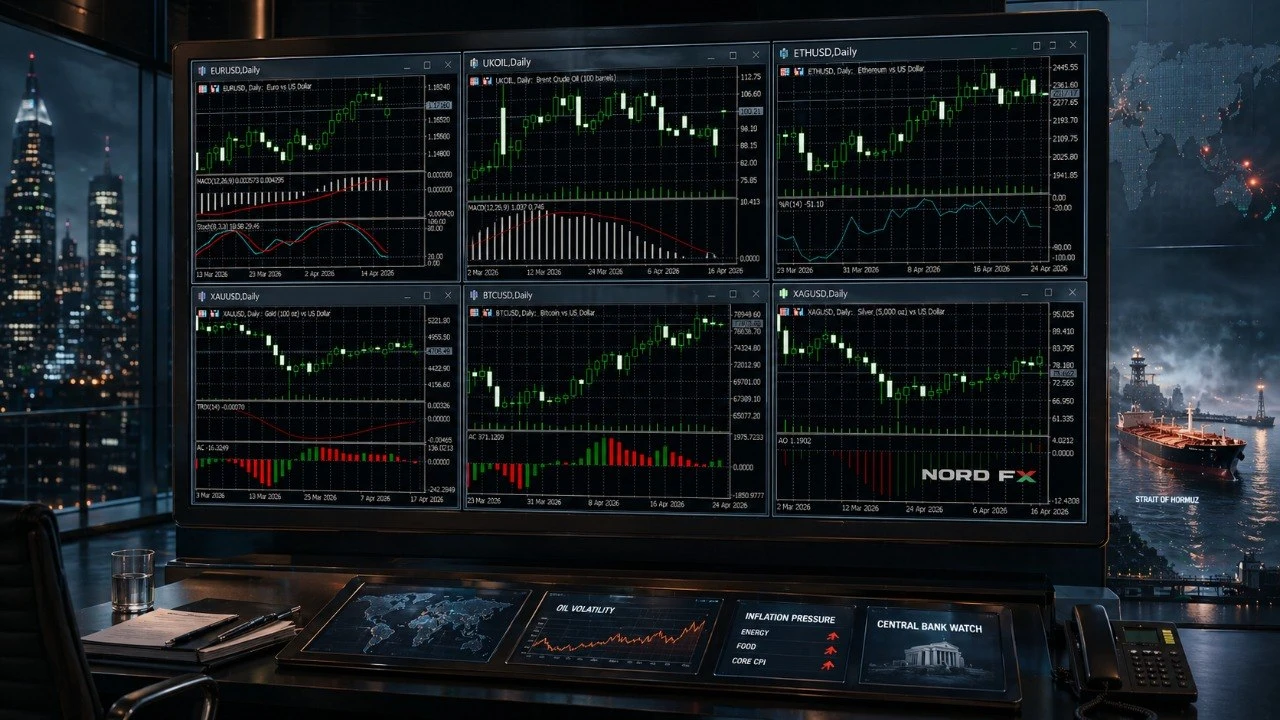
24 Nisan 2026 Cuma kapanış fiyatları:
EUR/USD - 1.1722 | Brent Ham Petrol - $105.33 | Altın (XAU/USD, Vadeli) - $4,740.90 | Gümüş (XAG/USD, Vadeli) - $76.414 | Bitcoin - $77,546 | Ethereum - $2,317.46
EUR/USD
EUR/USD haftayı 1.1722 seviyesinde kapattı; bu, önceki Cuma kapanışı olan 1.1764’ün altındaydı - haftalık yaklaşık %0.4’lük bir düşüş. Parite hafta içinde önemli dalgalanma yaşadı: Hürmüz Boğazı’ndaki tırmanışın USD’ye güvenli liman talebini artırmasıyla hafta ortasında iki haftanın en düşük seviyesi olan 1.1670’e geriledi, ancak Pakistan’da planlanan doğrudan ABD-İran görüşmeleri haberinin ardından Cuma öğleden sonra keskin biçimde toparlandı. Parite günü %0.33 yükselişle ve 1.1700 seviyesinin rahatça üzerinde tamamladı.
Avro için makro zemin zorlayıcı olmaya devam ediyor. Alman Ifo İş İklimi endeksi Nisan ayında 86.3’ten 84.4’e gerileyerek pandemiden bu yana en düşük seviyesine indi; bunun nedeni Orta Doğu çatışmasının yol açtığı enerji maliyetlerinin duyarlılığı baskılamasıydı. Euro Bölgesi Bileşik PMI 50.7 geldi ve daralmadan kıl payı kaçındı; hizmetler 50.2, imalat ise 51.6’ya toparlandı. Almanya Ekonomi Bakanlığı, çatışmanın yarattığı enerji şokunu gerekçe göstererek 2026 büyüme tahminini yarıya indirdi. ABD hizmet PMI 49.8’e gerilerken, imalat 52.3’te kaldı; bu da her iki ekonominin de güçlü durumda olmadığını gösteriyor - EUR/USD yönü için görece dengeli bir arka plan.
27 Nisan-1 Mayıs haftasında EUR/USD fiyat hareketini üç olay domine edecek. 29 Nisan’daki FOMC kararı en yüksek etkili olay: Powell, petrol kaynaklı enflasyonun faiz indirimlerini anlamlı biçimde geciktirdiğine işaret ederse doların güçlenmesi ve EUR/USD’nin 1.1630-1.1600 destek bölgesini test etmesi muhtemel. Powell 2026 faiz indirimlerini masada tutar ve enerji enflasyonunu geçici olarak tanımlarsa, euro toparlanabilir. 30 Nisan’daki ECB toplantısında temkinli bir tonla faizin sabit tutulması bekleniyor - bu da euroya anlamlı bir destek sağlaması açısından zayıf bir olasılık. Jeopolitik haber akışı ise belirleyici değişken olmaya devam ediyor: Hürmüz’de güvenilir bir diplomatik ilerleme petrolü aşağı çeker, USD güvenli liman talebini azaltır ve EUR/USD’yi tekrar 1.1800 ve üzerine taşıyabilir.
Direnç 1.1764, 1.1800 ve 1.1849 (son yıllık zirve) seviyelerinde. Destek 1.1680, 1.1630 ve 1.1600 seviyelerinde.
Temel görüş: 1.1764 altında nötrden hafif ayı yönlü. Güvercin bir FOMC tonu veya Hürmüz konusunda anlamlı diplomatik ilerleme, paritenin son zayıflığını tersine çevirebilecek ve onu yeniden 1.1800 üzerine taşıyabilecek iki katalizördür. Bunlardan biri olmaksızın, USD güvenli liman talebi, geciken Fed indirimleri ve zayıf Euro Bölgesi verilerinin bileşimi en kolay yolun aşağı yön olduğunu gösteriyor.
Brent Ham Petrol
Brent petrol haftanın en sert hareket eden varlığı oldu ve varil başına yaklaşık %14 yükselerek 105.33 dolardan kapandı. Ralli tamamen jeopolitik kaynaklıydı: Hürmüz Boğazı’nın devam eden kapanışı, İran limanlarına uygulanan ABD deniz ablukası, Trump’ın mayın döşeyen gemilerin “vurulup imha edilmesi” emri ve ABD Donanması’nın bir İran süpertankerine el koyması küresel arz akışlarını son derece sıkılaştırdı. EIA, tarihli Brent spot fiyatlarının ön ay vadeli kontratların 25 dolar üzerinde prim yaptığını doğruladı - bu, boğazın kapanmasından bu yana yakın vadeli piyasa sıkışıklığını yansıtan olağanüstü bir backwardation seviyesi. Cuma seansında Brent gün içinde 106 dolara kadar yükseldi, ardından barış görüşmelerine ilişkin iyimserlik sayesinde 105.33 dolara geriledi.
Önümüzdeki hafta için kritik değişken, 25-26 Nisan Cumartesi günü İslamabad’da yapılacak ABD-İran doğrudan görüşmelerinin sonucudur. Bu görüşmeler Hürmüz Boğazı’nın yeniden açılması için bir çerçeve veya anlamlı bir ateşkes iyileştirmesi üretirse, Brent jeopolitik risk priminin fiyatlardan çıkmasıyla hızlı biçimde varil başına 10-15 dolar kaybedebilir - bu da potansiyel olarak 90-95 dolar bölgesinin yeniden test edilmesine yol açabilir. Öte yandan, görüşmeler çöküşe uğrar ve İran boğaz üzerindeki kontrolünü sürdürür ya da sıkılaştırırsa, 110 dolar bir sonraki gerçekçi hedef haline gelir. FOMC toplantısı ve ABD 1. çeyrek GSYH verisi (30 Nisan) de dolar ve talep projeksiyonları üzerindeki etkileri nedeniyle petrolü etkileyecek. 1 Mayıs’taki Tarım Dışı İstihdam verisi haftayı tamamlayacak.
Direnç 107.00 dolar, 110.00 dolar ve 112.50 dolar seviyelerinde. Destek 103.00 dolar, 100.00 dolar ve 97.00 dolar seviyelerinde.
Temel görüş: Jeopolitik arz riski nedeniyle 103.00 doların üzerinde boğa yönlü. Ancak risk profili asimetriktir: diplomatik bir atılım, yakın vadede en güçlü ayı katalizörüdür ve bu artık çatışmanın başlamasından bu yana herhangi bir zamankinden daha yakındır. Yatırımcılar, İslamabad görüşmelerinin sonucuna bağlı olarak haftanın başında her iki yönde de sert hareketlere hazırlıklı olmalıdır.
Altın (XAU/USD)
Altın vadeli işlemleri haftayı 4,740.90 dolardan kapattı (Investing.com); Cuma sabahı görülen yaklaşık 4,658 dolarlık haftalık diplerden toparlanarak diplomatik iyimserliğin desteğiyle günü %0.36 yükselişle tamamladı. Cuma günkü kısmi toparlanmaya rağmen altın, önceki 4,879 dolarlık kapanışa kıyasla yaklaşık %3.2 haftalık düşüş kaydetti. Metal paradoksal bir ortamda yol alıyor: normalde altını desteklemesi beklenen jeopolitik şok, aynı anda petrol fiyatlarını yükseltiyor, enflasyon beklentilerini körüklüyor, doları güçlendiriyor ve Fed’in faizleri daha uzun süre yüksek tutma olasılığını pekiştiriyor - bunların hepsi getiri sağlamayan külçe altın için önemli baskılar. Altın, Orta Doğu çatışmasının başlamasından bu yana yaklaşık %10 gerilemiş durumda; buna karşın hisse senedi piyasaları genel olarak dayanıklı kaldı.
Önümüzdeki hafta altın için iki olası yön senaryosu sunuyor. Ayı senaryosunda: şahin bir FOMC (enerji kaynaklı enflasyonun faiz indirimlerini geciktirdiğini sinyallemesi) altını yeniden 4,680-4,640 dolar destek bölgesine iter ve başarısız diplomatik görüşmeler petrolü yüksek tutup enflasyon korkularını canlı bırakır. Boğa senaryosunda: Hürmüz’deki bir atılım petrol fiyatlarını düşürür ve enflasyon kaygılarını hafifletir, güvercin bir FOMC ise faiz indirim döngüsünü yolunda tutar - altın 4,840-4,912 dolar bölgesine toparlanabilir. 30 Nisan’daki ABD 1. çeyrek GSYH verisi de önemlidir: beklenenden zayıf bir okuma, faiz indirimi beklentilerini yeniden canlandırır ve altına destek sağlar. Daha uzun vadeli kurumsal fikir birliği ise hâlâ güçlü biçimde olumlu: Goldman Sachs yıl sonu için 5,400 dolar, JPMorgan 6,300 dolar hedefliyor; revize edilmiş Morgan Stanley tahmini bile 5,200 dolar ile mevcut seviyelerin oldukça üzerinde.
Direnç 4,780 dolar, 4,840 dolar ve 4,912 dolar seviyelerinde. Destek 4,680 dolar, 4,640 dolar ve 4,580 dolar seviyelerinde.
Temel görüş: Nötr. Altın, jeopolitik belirsizlik (boğa) ile petrol kaynaklı enflasyonun faiz beklentilerini yukarı itmesi (ayı) arasında sıkışmış durumda. 4,700-4,780 dolar aralığı yakın vadeli savaş alanı. 4,780 doların üzerinde net bir kırılma ve kapanış toparlanma ivmesine işaret eder; 4,640 doların altına sarkma ise 4,580 dolara doğru ek düzeltici düşüş anlamına gelir.
Gümüş (XAG/USD)
Gümüş vadeli işlemleri haftayı 76.414 dolardan kapattı (Investing.com); Cuma sabahı görülen 73.95 dolarlık gün içi diplerden güçlü biçimde toparlandı ve diplomatik haberlerin tetiklediği sert bir rahatlama sıçramasıyla günü %1.21 yükselişle tamamladı. Bu toparlanmaya rağmen gümüş, önceki 81.84 dolarlık kapanışa göre yaklaşık %6.6 haftalık düşüş kaydetti - altına göre belirgin biçimde zayıf performans gösterdi ve beş haftadaki ilk haftalık kaybını yaşadı. Gümüş çift yönlü baskı altındaydı: getiri sağlamayan bir varlık olarak petrol kaynaklı enflasyonun yarattığı yüksek faiz beklentileri tarafından baskılandı; ayrıca sanayi metali olarak yüksek enerji fiyatlarının yarattığı resesyon korkularına karşı hassas hale geldi; bunun elektronik, güneş enerjisi ve daha geniş imalat talebi üzerinde etkileri var.
Teknik olarak XAG/USD, Mart sonundaki diplerden başlayan yukarı yönlü kanalın altına kırdı ve Perşembe günkü ayı impulsif mum satıcı kontrolünü doğruladı. Hem 50 günlük SMA (~78 dolar) hem de 100 günlük SMA (~79 dolar) artık önemli yukarı direnç olarak öne çıkıyor. Nisan rallisinin %38.2 Fibonacci düzeltmesi olan yaklaşık 74.60 dolar bölgesi geçici destek sağladı; ancak 73.95 dolarlık gün içi dip, test edilip tutunan daha yakın vadeli bir taban niteliğinde. 73.95 doların altına kırılma, 72.60 dolar (Nisan dipleri) ve 72.00 dolar bölgesine giden yolu açar. Önümüzdeki hafta gümüşün yönü petrol fiyatları ve diplomatik zeminle yakından bağlantılı olacak. Petrolü düşüren ve enflasyon korkularını hafifleten bir Hürmüz atılımı, gümüş için en güçlü boğa katalizörü olacaktır.
Direnç 77.00 dolar, 78.00 dolar (50 günlük SMA) ve 79.00 dolar (100 günlük SMA) seviyelerinde. Destek 74.60 dolar (%38.2 Fib), 73.95 dolar (son gün içi dip) ve 72.60 dolar seviyelerinde.
Temel görüş: 77.00 doların altında ayı yönlü. Yakın vadeli teknik yapı ve makro ortam, petrolün diplomatik ilerleme ile sert biçimde geri dönmediği ya da FOMC’nin güvercin bir sabitle sürpriz yapmadığı sürece daha fazla aşağı yönü destekliyor. 74.60 doların altında haftalık kapanış, ayı momentumunu teyit eder ve bir sonraki düşüş ayağını açar.
Bitcoin (BTC/USD)
Bitcoin haftayı 77,546 dolardan kapattı (Investing.com); önceki haftanın yaklaşık 77,127 dolarlık kapanışına göre %1’den az artışla tamamladı - haftanın yüksek makro ve jeopolitik oynaklığı düşünüldüğünde son derece istikrarlı bir sonuç. Haftanın belirleyici kurumsal olayı, Strategy’nin 2.54 milyar dolarlık Bitcoin alımı (34,164 BTC) duyurusuydu; bu, 2024’ten bu yana en büyük alımıydı ve toplam varlıklarını 815,061 BTC’ye çıkardı. Buna, küresel kripto fonlarına gelen toplam 1.4 milyar dolarlık haftalık giriş eşlik etti - Ocak ortasından bu yana en güçlü hafta - ve bunun 1.12 milyar doları Bitcoin’e yöneldi. Nomura’nın bir anketi, Japon kurumsal yatırımcıların %65’inin artık portföy çeşitlendirmesi için Bitcoin tuttuğunu doğruladı. Bitcoin ayrıca kısa vadeli sahiplerin gerçekleşmiş fiyatının (~69,400 dolar) üzerine çıktı; bu, tarihsel olarak zincir üstü önemli bir metrik olup zincirleme tasfiye riskini azaltır.
Bu kurumsal destek unsurlarına rağmen Bitcoin, son iki ayda bu bölgede üst üste dördüncü kez başarısız olarak 78,000-80,000 dolar üzerindeki kalıcı kırılmayı gerçekleştirmekte zorlanmaya devam etti. Türev verileri, her yükselişin esas olarak short kapanışlarıyla (uzun süre negatif fonlama oranları) desteklendiğini, gerçek yeni talepten değil, gösterdi. Açık faiz Cuma günü 24 saat içinde %6’dan fazla düştü; bu da fiyatlar yataylaşırken kaldıraç çözülmesine işaret ediyor. Önümüzdeki hafta için 29 Nisan’daki FOMC tonu ana makro katalizör olacak. Şahin bir sürpriz Bitcoin’i yeniden 75,000-74,500 dolar destek bölgesine itebilir; güvercin bir sinyal ise 80,000 dolara doğru yükseliş denemesini yeniden canlandırabilir. ABD-İran görüşme sonuçları da pazartesi açılışından itibaren genel risk algısını etkileyecek.
Direnç 78,500 dolar, 80,000 dolar (kilit psikolojik seviye) ve 82,000 dolar seviyelerinde. Destek 75,800 dolar, 74,500 dolar ve 73,000 dolar seviyelerinde.
Temel görüş: 75,800 doların üzerinde hafif boğa yönlü; güçlü kurumsal birikim anlatıları ve iyileşen zincir üstü metrikler tarafından destekleniyor. Ancak yapısal momentumu net biçimde yukarı çevirmek için 80,000 doların üzerinde sürdürülebilir haftalık kapanış gerekiyor. O zamana kadar 74,500-78,500 dolar aralığı piyasayı tanımlamaya devam ediyor. FOMC tonu ve Hürmüz diplomasisinin sonucu ana salınım faktörleri.
Ethereum (ETH/USD)
Ethereum haftayı 2,317.46 dolardan kapattı (Investing.com); önceki haftanın 2,420 dolarlık kapanışına göre yaklaşık %4.2 düşüş kaydetti. ETH, riskten kaçış dönemlerinde altcoinlerden Bitcoin’e kayan sermaye, kritik 2,400 dolar direnç bölgesinde teknik reddedilme ve Cuma günkü 8.6 milyar dolarlık BTC/ETH opsiyon vadesinin gün içi oynaklığı artırması nedeniyle aşağı çekildi. Bu baskılara rağmen olumlu kurumsal sinyaller altta destek sağladı: BitMine Immersion Technologies arzı kilitlemek için 142 milyon dolarlık ETH stake etti, BlackRock 53.6 milyon dolarlık spot ETH ETF hissesi satın aldı ve toplam haftalık spot ETH ETF girişleri 328 milyon dolara ulaştı. ETH fiyatı şu anda 50 günlük EMA’sına (~2,320 dolar) yakın ve 200 günlük MA’sının (~2,310 dolar) hemen üzerinde; bu da mevcut seviyeyi kritik bir teknik dönüm noktası haline getiriyor.
Önümüzdeki hafta Ethereum’un yönü büyük ölçüde Bitcoin ile aynı makro katalizörler - FOMC tonu ve jeopolitik gelişmeler - tarafından belirlenecek, ancak her iki yönde de daha yüksek beta ile. Risk iştahının arttığı bir ortam (güvercin Fed + Hürmüz atılımı) ETH’ye BTC’den yüzde olarak daha fazla fayda sağlar. Bununla birlikte ETH, mevcut döngüde Bitcoin’e karşı sürekli olarak zayıf performans gösteriyor; ETH/BTC oranı aşağı yönlü sürükleniyor ve Ethereum’a özgü katalizörler hızlanmadıkça bu eğilim sürebilir. 2,380 doların üzerinde haftalık kapanış, ivme toparlanmasının ilk önemli işareti olacaktır. 2,260 dolar desteğinin korunamaması, 2,200 dolar bölgesini ve potansiyel olarak 2,100 doları açığa çıkarır.
Direnç 2,380 dolar, 2,420 dolar (önceki haftalık kapanış) ve 2,465 dolar seviyelerinde. Destek 2,260 dolar, 2,200 dolar ve 2,100 dolar seviyelerinde.
Temel görüş: 2,380 doların altında nötr ve hafif ayı yönlü. ETH’nin yolu büyük ölçüde genel piyasa duyarlılığı ve Bitcoin’in yönü tarafından belirleniyor. Mevcut fiyat seviyelerine yakın kilit hareketli ortalamaların yakınsaması burayı belirleyici bir bölge haline getiriyor. Güçlü ve istikrarlı spot ETF girişleri yapısal olarak olumlu, ancak ETH’nin ikna edici biçimde yukarı kırılması için makro ortamın iyileşmesi gerekiyor.
Sonuç
27 Nisan - 1 Mayıs 2026 haftası, küresel finansal piyasalar için yılın bugüne kadarki en kritik haftası olabilir. FOMC kararı (29 Nisan), ABD 1. çeyrek GSYH verisi (30 Nisan), ECB toplantısı (30 Nisan) ve Tarım Dışı İstihdam (1 Mayıs) eşi benzeri görülmemiş bir makro katalizör yoğunluğu sağlıyor. Bunların üzerinde ise jeopolitik değişken yer alıyor: 25-26 Nisan hafta sonunda İslamabad’da yapılacak ABD-İran doğrudan görüşmelerinin sonucu, gelecek haftanın tüm verilerinin yorumlanacağı enerji fiyatı, enflasyon ve risk algısı zeminini belirleyecek.
EUR/USD orta düzeyde ayı baskısı altında, ancak diplomasi sonuç verirse anlamlı yukarı potansiyelini koruyor. Brent petrol, jeopolitik arz riskiyle yönlendirilen son bir yılı aşkın sürenin en yüksek haftalık kapanış seviyesinde; ancak boğaz yeniden açılırsa aynı derecede güçlü bir aşağı yön riskiyle karşı karşıya. Altın, geleneksel sürükleyicilerinin ters yönlere çektiği benzersiz bir paradoksu yönetiyor. Gümüş bu rapordaki teknik olarak en kırılgan enstrüman. Bitcoin, sağlam kurumsal destekle çok aylık zirveler yakınında konsolide oluyor ancak bir sonraki ayağı doğrulamak için 80,000 dolar kırılımına ihtiyaç duyuyor. Ethereum, ek olarak risk iştahı ve ETF akımlarına duyarlılıkla Bitcoin’i yakından takip ediyor.
Tüm enstrümanlarda temel mesaj açık: Bir sonraki büyük yön hareketi yalnızca teknik kalıplarla değil, diplomasinin - ya da onun kesin yokluğunun - önümüzdeki günlerde küresel enerji görünümünü yeniden şekillendirip şekillendirmeyeceğiyle belirlenecek.
NordFX Analitik Grubu
Yasal Uyarı: Bu materyaller bir yatırım tavsiyesi veya finansal piyasalarda işlem yapmaya yönelik bir rehber değildir ve yalnızca bilgilendirme amaçlıdır. Finansal piyasalarda işlem yapmak risklidir ve yatırılan fonların tamamen kaybına yol açabilir.
Geri dön Geri dön
