Candlestick analysis remains one of the simplest yet most powerful tools for traders. Among the many chart formations, the engulfing candlestick pattern stands out as one of the most direct ways to visualize a potential reversal in price momentum. When traders talk about an engulfing candle, they usually refer to a setup where one candlestick completely covers or “engulfs” the previous one, suggesting a change in control between buyers and sellers.
This article explores the logic behind the engulfing pattern, how to identify and trade the bearish engulfing candle, and how to apply the formation across markets. It also answers the most common questions traders ask about engulfing patterns, reliability, and strategy.
What Is an Engulfing Pattern?
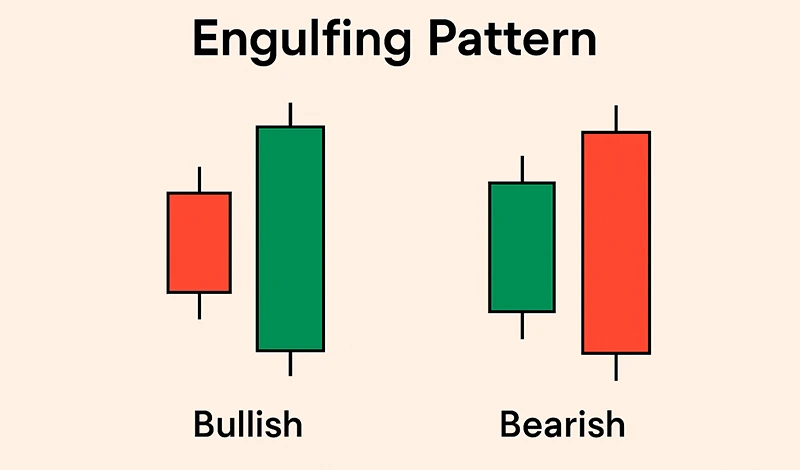
An engulfing pattern is a two-candle formation that signals a potential shift in market sentiment. The second candle completely engulfs the body of the first candle, showing that momentum has moved decisively in the opposite direction.
The first candle is smaller and represents the fading strength of the current trend. The second, larger candle represents new momentum in the opposite direction, which is why many traders see the engulfing candlestick pattern as a possible turning point on the chart.
Engulfing patterns can be bullish or bearish depending on their position and direction. When they appear after a prolonged uptrend, they may signal exhaustion among buyers and the start of selling pressure. When they form after a downtrend, they often indicate that selling has weakened and buyers are stepping in.
What Is an Engulfing Candle?
An engulfing candle is simply the second candle in the pattern. It opens beyond the previous candle’s close and closes beyond its open, completely covering the prior body. This engulfing action visually demonstrates that the market’s balance has shifted.
For traders, the engulfing candle itself represents conviction. The larger its real body compared to the previous candle, the stronger the potential reversal signal. However, its meaning is always dependent on context: trend direction, volume, nearby support or resistance, and the overall market structure.
The Bearish Engulfing Pattern Explained
A bearish engulfing pattern appears after an upward price move and signals that selling pressure has overtaken buying enthusiasm. The first candle is bullish, showing that buyers still had control at the start. The second candle opens higher, but strong selling pushes it to close well below the first candle’s open, engulfing it completely.
This sequence shows how quickly sentiment can shift. Buyers start the session in control, but by the close, sellers have overwhelmed them. The appearance of a bearish engulfing often marks the beginning of a downward move or at least a pause in the uptrend.
Traders who see a bearish engulfing candle at the top of a rally or near a key resistance level often interpret it as an early sign of reversal. It suggests that those who were buying aggressively are now trapped at higher prices, which can accelerate selling as they exit.
Psychology Behind the Engulfing Candlestick Pattern
Candlestick patterns visualize human behavior. The engulfing pattern represents a sudden emotional shift between optimism and pessimism. In a bullish market, optimism drives prices higher, but the bearish engulfing candle reflects a strong reaction — sellers appear and dominate. In a downtrend, the bullish engulfing pattern shows the opposite psychology: exhaustion among sellers and renewed confidence among buyers.
This emotional change is why engulfing patterns are popular in discretionary and algorithmic trading alike. They visually mark where a crowd changes its mind.
Identifying an Engulfing Pattern Step by Step
1. Confirm that a clear trend exists before the pattern forms.
2. Observe the first candle: small body in the direction of the current trend.
3. Watch for the next candle to open beyond the prior close and move in the opposite direction, with a body that completely engulfs the previous one.
4. The longer and more dominant the engulfing candle, the stronger the signal.
5. Check where it appears — near a resistance level, support zone, or moving average line adds importance.
6. Wait for a follow-through candle or break of a nearby level before making any decision.
Engulfing Pattern vs. Other Reversal Formations
The engulfing candlestick pattern differs from formations like doji or hammer candles because it uses two distinct sessions to show a change in control. The pattern doesn’t rely on wicks or shadows but on the bodies of the candles themselves. This makes it more straightforward to spot and easier to code for algorithmic trading systems.
Compared to the harami pattern, which shows decreasing volatility, the engulfing pattern represents an expansion of range and energy. That’s why traders often view it as a more decisive reversal signal.
How to Trade the Bearish Engulfing Pattern
Entry Timing
Once a bearish engulfing pattern is confirmed, traders usually wait for the next candle to close below the engulfing candle’s low before entering. Some traders prefer immediate entry after the pattern forms, while conservative traders look for confirmation.
Stop-Loss Placement
A typical protective stop is set just above the high of the engulfing candle. If the market moves back above that point, the reversal idea is invalidated.
Take-Profit Strategy
Common take-profit levels include prior support zones, Fibonacci retracements, or risk-reward ratios of 1:2 or better. Some traders scale out as the price moves in their favor.
Combining Indicators
Moving averages, RSI, MACD, or volume can strengthen confidence in the signal. For example, a bearish engulfing that forms when the RSI is overbought or price touches a resistance trendline tends to be more reliable.
Bullish vs. Bearish Engulfing
Both types of engulfing pattern share the same logic: one side of the market overwhelms the other. The direction simply changes.
- Bullish engulfing: appears after a downtrend, where the large bullish candle engulfs a smaller bearish one. It signals buying interest returning to the market.
- Bearish engulfing: appears after an uptrend, where a large bearish candle swallows the smaller bullish one. It signals possible selling pressure or profit taking.
Neither pattern guarantees a reversal; both require confirmation. However, traders often find the bearish engulfing candle to be more visible on charts because strong selling tends to produce larger moves.
Trading the Engulfing Pattern Across Markets
Forex
Currency pairs often produce clear engulfing candles because of the constant liquidity. On higher timeframes such as daily charts, a bearish engulfing at the end of a rally can provide an early sign of trend change. However, short-term traders must be careful of false signals that occur during quiet sessions.
Stocks
The engulfing candlestick pattern in equities is frequently used to spot reversals following overextended rallies or declines. Volume confirmation is essential here; an engulfing candle with high volume has greater significance than one with light trading.
Crypto
Cryptocurrency markets move continuously without daily gaps, yet engulfing patterns remain useful. Because of higher volatility, traders often apply tighter stops or look for additional confirmation before acting on a bearish engulfing candle.
Commodities and Indices
These markets often respond well to the engulfing pattern when combined with macro factors such as supply data or sentiment shifts. For example, a bearish engulfing on gold after a strong rally may align with broader market risk sentiment.
Factors That Strengthen an Engulfing Signal
1. Appears at a clear swing high or swing low.
2. Occurs at major resistance or support zones.
3. Volume increases noticeably during the engulfing candle.
4. The second candle’s body fully covers both the open and close of the first.
5. The overall trend has been extended or showing exhaustion before the pattern appears.
6. When these conditions align, the engulfing pattern becomes a higher-probability setup.
Common Questions About Engulfing Candles
What is the ideal timeframe for engulfing patterns?
They can form on any timeframe, but higher timeframes like 4-hour or daily charts are generally more reliable because they reduce market noise.
Can the engulfing candle appear in sideways markets?
Yes, but it tends to be less effective. The engulfing pattern works best when it signals exhaustion of a strong move rather than random fluctuations.
Does the body need to cover the shadows?
The critical requirement is that the body of the second candle engulfs the body of the first. Shadows may or may not be covered; traders differ on how strict they are.
Is volume necessary for confirmation?
While not mandatory, rising volume during the engulfing candle increases reliability by showing stronger participation.
Can multiple engulfing patterns appear consecutively?
Yes. This may indicate high volatility or indecision. When several appear together, traders often step back until the market direction becomes clearer.
Are engulfing patterns reliable on small timeframes?
They appear often on short intervals, but many are noise. Combining the signal with other analysis tools helps filter false setups.
Do engulfing patterns provide price targets?
The pattern itself shows direction, not distance. Traders estimate targets based on structure, support/resistance, or measured moves.
What happens if a bearish engulfing candle fails?
Failure means price doesn’t continue lower and instead breaks above the engulfing high. This can trigger a quick opposite move, so risk management is essential.
What account type is suitable for trading candlestick patterns like the engulfing pattern?
A standard or professional trading account that offers tight spreads, fast execution, and access to multiple asset classes is ideal. Since candlestick patterns rely on precise price movements, an account with minimal slippage and competitive trading costs allows traders to interpret signals more accurately. For beginners, a basic account with low minimum deposits can help practice without major risk, while experienced traders may prefer advanced or zero-spread accounts for better control and higher efficiency.
What trading platform is suitable for analyzing and trading engulfing patterns?
MetaTrader 4 and MetaTrader 5 are among the best trading platforms for trading candlestick patterns. They provide clear charting tools, adjustable timeframes, and the ability to overlay indicators for confirmation. Traders can easily spot engulfing candles, draw support and resistance levels, and automate strategies if desired. Both platforms are stable, widely supported by brokers, and suitable for manual as well as algorithmic trading.
Reliability and Limitations
Although the engulfing candlestick pattern is simple to recognize, it’s not flawless. Its success rate varies depending on the market, timeframe, and accompanying analysis.
Common mistakes include trading it in isolation, ignoring the larger trend, or assuming every engulfing candle will lead to a major reversal. The pattern can also appear frequently in consolidations, where reversals have little follow-through.
To improve reliability, traders combine the engulfing pattern with confirmation signals such as trendline breaks, moving-average crosses, or oscillator divergence. The pattern then serves as a trigger rather than the sole decision factor.
Using the Engulfing Pattern in a Trading Plan
1. Identify trend direction.
2. Watch for an engulfing candle forming at a key level.
3. Wait for the next candle to confirm direction.
4. Enter trade with a predefined stop-loss.
5. Manage the trade actively or exit at key targets.
Risk management is central. Even the most promising bearish engulfing pattern can fail in strong uptrends or during news events. Limiting exposure to a small percentage of capital per trade ensures long-term sustainability.
Engulfing Pattern and Market Psychology
Market psychology explains why engulfing candles are meaningful. When traders see a large candle moving opposite the prior trend, it reflects fear among those caught on the wrong side. Stops are triggered, liquidity increases, and momentum accelerates.
The bearish engulfing pattern especially demonstrates how enthusiasm fades near market highs. As early sellers take profits and new shorts enter, momentum shifts downward. Recognizing this collective reaction helps traders act before the majority notice.
Enhancing Accuracy with Technical Tools
- Moving averages: if the engulfing pattern forms near a long-term average, it often marks a change in trend.
- Trendlines: breaks combined with an engulfing candle confirm directional change.
- Momentum indicators: divergence between price and indicators like RSI supports the reversal story.
- Price zones: confluence with previous highs or lows strengthens conviction.
By layering these confirmations, traders turn a visual pattern into a structured trade setup.
Back-Testing and Practice
Before relying on engulfing patterns in live markets, back-testing is crucial. Reviewing historical charts allows traders to measure frequency, success rate, and ideal conditions. Key points to observe:
- How often does the pattern appear before meaningful moves?
- What happens when confirmation is required versus instant entry?
- How do risk-reward ratios perform across timeframes?
Consistent back-testing helps convert visual observation into measurable rules, bridging intuition and data.
Common Pitfalls When Trading Engulfing Candles
1. Acting on every occurrence without context.
2. Ignoring the trend or broader chart structure.
3. Placing stops too tight, leading to whipsaws.
4. Trading during illiquid hours when candles lack significance.
5. Expecting large reversals from small setups.
Avoiding these errors turns the engulfing pattern from a beginner’s visual cue into a disciplined analytical tool.
Summary and Key Takeaways
- The engulfing candlestick pattern consists of two candles showing a reversal in control between buyers and sellers.
- The engulfing candle itself is the decisive move, engulfing the prior candle’s body completely.
- A bearish engulfing pattern appears at the end of an uptrend and may signal the start of a downward movement.
- Effectiveness increases when combined with trend analysis, volume, and key price levels.
- The pattern can be used across all markets and timeframes, though higher timeframes provide better reliability.
- Proper risk management, confirmation, and patience are essential for consistent use.
Recognizing a clear engulfing pattern can offer valuable insight into market behavior. Yet it should be viewed not as a guaranteed trading signal but as part of a broader decision-making framework built on context and discipline.
Final Thoughts
The engulfing pattern remains one of the most recognizable formations in technical analysis. It captures a moment of imbalance when one side of the market overwhelms the other, reflecting human emotion through price movement. Whether analyzing a bearish engulfing candle at the top of a trend or a bullish reversal after a decline, understanding what the market is communicating is the real edge.
By combining sound analysis, patience, and strict money management, traders can use the engulfing candlestick pattern to better time entries, exits, and expectations across any market environment.
FAQ
What is an engulfing candlestick pattern?
An engulfing candlestick pattern is a two-candle formation that shows a possible shift in market direction. The second candle completely covers the body of the first one, signaling that one side of the market has gained control over the other. It’s often used as a clue that a current trend might be losing strength.
What does the term engulfing candle mean in trading?
An engulfing candle is the larger, second candle in the pattern. It opens beyond the previous candle’s close and closes beyond its open, visually “engulfing” it. This strong movement suggests a decisive change in momentum between buyers and sellers.
How does the engulfing pattern work in technical analysis?
In technical analysis, the engulfing pattern works as a reversal signal. It shows that the previous trend may be ending because the market sentiment has shifted sharply. Traders interpret this change as an opportunity to prepare for a move in the opposite direction.
What is the difference between a bullish and bearish engulfing pattern?
A bullish engulfing pattern forms after a downtrend, with a large bullish candle covering a smaller bearish one, hinting at a potential rise in prices. A bearish engulfing appears after an uptrend, where a large bearish candle engulfs a smaller bullish one, suggesting that sellers may start taking control.
Why is the engulfing candlestick pattern important for traders?
The engulfing pattern is important because it visually reflects a sudden and clear change in market sentiment. It helps traders identify possible reversals, manage risk more effectively, and time their entries or exits based on shifts in supply and demand.
What timeframes are best for identifying engulfing candles?
Engulfing candles can appear on any chart, but they tend to be more reliable on higher timeframes such as the four-hour, daily, or weekly charts. On smaller intervals, frequent market noise can create many false signals.
Is the engulfing pattern reliable for beginners?
It can be reliable if used carefully. Beginners should focus on recognizing engulfing patterns in clear trends and combine them with other confirmation tools such as support and resistance or volume. Relying on the pattern alone can lead to errors.
What is a bearish engulfing pattern?
A bearish engulfing pattern is a two-candle setup that appears after an upward move. The first candle is bullish, while the second is a larger bearish one that completely covers the first candle’s body. It warns that selling pressure has overtaken buying interest.
How can you recognize a bearish engulfing candle on a chart?
You can spot it by finding an uptrend followed by a small bullish candle and then a larger bearish candle that opens higher and closes below the first candle’s open. The second candle’s size and position clearly show the shift in control.
What does a bearish engulfing candle indicate about market sentiment?
It indicates that confidence among buyers has weakened and sellers have stepped in with strength. The transition from optimism to caution or fear often leads to a short-term or even long-term downward move in price.
Is the bearish engulfing pattern a reversal or continuation signal?
The bearish engulfing pattern is usually seen as a reversal signal. It often appears near the top of an uptrend, showing that the buying momentum has faded and sellers are starting to dominate. However, in some cases, it can also signal a brief pause before the trend continues, so context always matters.
How strong is the bearish engulfing signal in forex and stock trading?
Its strength depends on where it forms and how large the second candle is compared to the first. In forex and stocks, a bearish engulfing pattern that appears near a resistance level or after a long rally tends to be more reliable. When confirmed by volume or other indicators, it can be a strong signal of a potential reversal.
What confirms a bearish engulfing pattern?
Confirmation usually comes from the following candle closing lower than the engulfing candle’s low, or from a break of nearby support. Traders also look for increasing volume or other bearish signals like momentum loss to validate the pattern.
What happens after a bearish engulfing pattern appears?
After a bearish engulfing pattern forms, price often moves sideways for a short time and then starts to decline as more sellers enter the market. The size and speed of the move depend on market conditions and how strongly the prior trend is reversed.
Is a bearish engulfing candle always followed by a downtrend?
Not always. While it frequently marks the beginning of a decline, sometimes it only causes a brief pullback before the trend continues upward. That’s why traders wait for confirmation before acting, instead of assuming a guaranteed reversal.
What is the psychology behind the bearish engulfing pattern?
This pattern reflects a sudden change in sentiment. Buyers push prices higher at first, continuing the uptrend, but sellers step in aggressively and drive the price below the previous candle’s open. The shift reveals hesitation among buyers and growing conviction among sellers.
How can traders use volume to confirm a bearish engulfing setup?
If the volume increases during the formation of the engulfing candle, it signals that sellers are acting with strength and conviction. A low-volume engulfing candle might still work, but higher participation makes the signal more trustworthy.
Which is stronger — bullish or bearish engulfing pattern?
Neither is inherently stronger; their power depends on context. A bearish engulfing pattern forming at a market top is just as meaningful as a bullish one forming at a bottom. What matters most is how they align with trend structure and other supporting signals.
Can a bearish engulfing pattern appear after a bullish trend?
Yes, and that’s exactly where it has the most meaning. It appears after a bullish trend to show that the momentum has shifted and selling pressure is now outweighing buying strength.
What happens when both bullish and bearish engulfing patterns appear close together?
When both types of engulfing patterns appear in a short period, it usually signals indecision or volatility. The market is struggling to choose a clear direction, so traders often wait for a confirmed breakout or stronger trend before making any move.
How to identify an engulfing pattern step by step?
First, confirm a clear prior move (up for bearish, down for bullish). Then spot a small candle in the direction of that move. Next, wait for the following candle to open beyond the prior close and close beyond the prior open, fully covering the first candle’s body. Finally, check location (near a key level) and wait for a small confirmation, like a close through a nearby level.
What are the key characteristics of an engulfing candlestick pattern?
It’s a two-candle formation where the second candle’s real body fully covers the first candle’s real body and moves opposite to the prior trend. The best examples appear at swing highs or lows, show a noticeable size difference, and occur where many traders watch (support, resistance, moving averages).
Does the second candle need to completely cover the previous one?
Yes, the body should engulf the prior body for a classic reading. Wicks don’t have to be fully covered, but a clean body-over-body engulfing is what gives the pattern its edge.
Can an engulfing candle appear in any time frame?
It can appear on all time frames. Reliability generally improves as you move higher (4H, daily, weekly) because there’s less noise and fewer random spikes.
What are the ideal conditions for an engulfing pattern to be valid?
A clear prior trend, a meaningful level nearby, a strong second candle that closes decisively, and some form of follow-through on the next bar. Extra points if the market was stretched or overextended before the pattern prints.
How to filter false engulfing signals?
Focus on clean trends, major levels, and strong closes. Avoid patterns printed during thin liquidity or in choppy ranges. Ask for confirmation: a lower low after bearish engulfing or a higher high after bullish engulfing. Add a simple filter like minimum candle size relative to recent bars.
How to trade the bearish engulfing pattern in forex?
Wait for the pattern near resistance after a push higher. Enter on a break below the engulfing candle’s low or after a minor pullback into its body. Place a stop above the engulfing high and target the next support or a fixed risk-reward (for example 1:2). Mind session timing; signals around major overlaps tend to carry more weight.
How does the engulfing candle pattern work in stock trading?
The logic is the same, but session gaps and earnings news matter. A bearish engulfing into known resistance with rising volume is more compelling. Many stock traders layer in volume and sector/market context before acting.
Can the engulfing candlestick pattern be used in crypto trading?
Yes. Because crypto is volatile and trades 24/7, ask for stronger confirmation and be strict with stops. Patterns that form at well-tested levels or after extended runs tend to perform better.
Is the engulfing pattern effective in commodities and indices?
It can be, especially when it aligns with macro catalysts or scheduled data releases. Look for confluence with trendlines, prior swing areas, and round numbers that attract orders.
Does the engulfing pattern work in both trending and ranging markets?
It works best at turning points in trends. In ranges, it can still help at the edges, but the follow-through is often limited. In sideways conditions, trade smaller targets and be ready to take profits near the opposite side of the range.
What indicators can confirm an engulfing pattern signal?
Momentum and volume indicators are most helpful. Rising volume during the engulfing candle shows conviction. An RSI divergence or MACD crossover in the same direction strengthens the case. Some traders also check stochastic or momentum oscillators to confirm that the market is losing steam before the reversal.
Can moving averages improve engulfing pattern accuracy?
Yes. If a bearish engulfing forms near or above a key moving average, such as the 50- or 200-period line, it suggests that price is rejecting a resistance area. When both the pattern and the moving averages point in the same direction, confidence in the trade increases.
How to set stop-loss and take-profit with a bearish engulfing pattern?
A logical stop-loss goes just above the high of the engulfing candle, since a move beyond that level cancels the bearish idea. For profit targets, traders often aim for the next support area or use a fixed ratio like two times the risk. Trailing stops can lock in gains as the price continues downward.
What is the best entry point after a bearish engulfing candle?
Many traders wait for a break below the engulfing candle’s low to confirm follow-through. Others prefer a small pullback toward the middle of the engulfing body to get a better price. The key is waiting for evidence that sellers remain in control before entering.
How do traders combine engulfing patterns with support and resistance?
An engulfing pattern gains more meaning when it forms at a level the market already respects. For example, a bearish engulfing at long-term resistance can mark the start of a drop, while a bullish one at support may signal a bounce. These zones act as filters to avoid random setups.
Can Fibonacci retracement help confirm an engulfing setup?
It can. When a bearish engulfing pattern aligns with a Fibonacci retracement level—say the 61.8% retracement of a prior decline—it adds technical confluence. This combination helps identify where reversals are most likely to start.
How to backtest an engulfing candlestick strategy?
Define clear rules: the trend context, candle size requirements, confirmation signals, and risk parameters. Scan historical charts, record every valid setup, and measure outcomes over a large sample. Pay attention to win rate, average reward-to-risk, and drawdowns. Adjust filters and re-test until the approach shows consistent results.
What market psychology does the engulfing pattern represent?
It represents a sudden shift in control. Traders who were confident in the existing trend are caught off guard as the opposing side overwhelms them. The engulfing candle reflects surprise, forced position changes, and renewed momentum in the opposite direction.
Why do engulfing candles often appear at market tops or bottoms?
They form where crowd sentiment peaks. At a top, buyers push prices higher but run out of strength; strong selling then engulfs their gains. At a bottom, the reverse happens as sellers exhaust themselves and buyers step in forcefully.
How do traders interpret engulfing candles in volatile markets?
In fast markets, engulfing candles show the battle between panic and greed. They can mark the end of emotional swings, but volatility also raises the risk of false signals. Many traders wait for a second bar or a confirmation break before reacting.
Are engulfing patterns more common in emotional markets?
Yes, because emotional trading leads to strong one-sided moves followed by sharp reversals. Fear and greed fuel the size difference between the two candles, creating clear engulfing shapes on the chart.
How accurate is the bearish engulfing pattern?
Accuracy depends on trend quality, timeframe, and context. On higher charts and near significant resistance, the pattern can work well. In sideways or low-volume conditions, its success rate drops sharply. It’s a useful signal, not a guarantee.
What are the common mistakes traders make with engulfing patterns?
They often trade every pattern they see without considering trend or level, ignore confirmation, or use stops that are too tight. Others over-leverage, assuming the pattern ensures a reversal. Treating it as part of a broader plan rather than a standalone signal helps avoid these errors.
Why do some engulfing patterns fail?
They fail when the market lacks clear direction or liquidity. Sometimes, what looks like an engulfing pattern is just random price movement with no real shift in sentiment. False signals also appear when traders ignore broader factors like trend strength, major news, or higher time frame structure.
How can traders improve the success rate of engulfing signals?
Focusing on quality over quantity helps most. Only trade patterns that appear near important support or resistance levels, align with volume spikes, or show follow-through in the next candle. Combining the pattern with additional tools, such as moving averages or momentum indicators, can also increase accuracy.
Should you rely solely on the engulfing candlestick pattern?
No. The pattern is a useful signal, but it’s only one piece of information. Relying on it alone can be risky because markets are influenced by many factors. It works best when used alongside other technical tools, confirmation candles, and sound risk management.
How does the engulfing pattern perform compared to other reversal patterns?
The engulfing pattern is simple and easy to spot, which makes it popular. It tends to appear more frequently than multi-candle reversals like morning stars or evening stars, but it can also produce more false signals. Its strength lies in its clarity and quick appearance after strong moves.
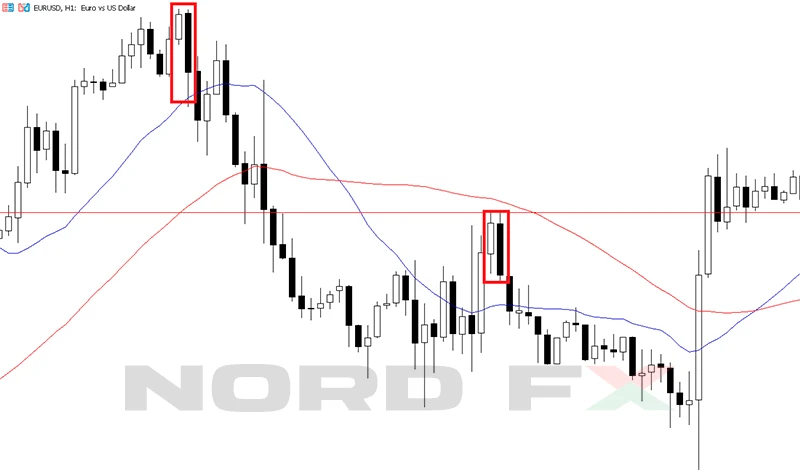
Can you give examples of a bearish engulfing pattern in real charts?
They often appear at the end of strong rallies, such as when price reaches a long-term resistance line and forms a large bearish candle that covers the previous bullish one. These are typically followed by a pullback or deeper correction, confirming that sellers have taken control.
What does a perfect bearish engulfing candle look like?
It forms after a clear uptrend, with a small bullish candle followed by a large bearish candle that opens higher and closes well below the first candle’s open. The second candle’s body is long and dominant, showing strong selling pressure and little hesitation.
How do professional traders use the engulfing candlestick pattern?
Professionals rarely trade it in isolation. They use it to fine-tune entries within broader setups, such as near trendline breaks or Fibonacci retracements. Many see it as confirmation that the market’s momentum is shifting rather than as a standalone reason to open a trade.
What lessons can beginners learn from false engulfing signals?
Beginners learn that context is everything. A pattern that looks perfect on one chart can fail on another if it appears in the wrong place. The lesson is to always confirm with trend, volume, and structure before risking money.
How to spot a high-probability bearish engulfing setup?
Look for a clean uptrend that shows signs of exhaustion, such as slowing momentum or overbought indicators. Then find a bearish engulfing candle forming at resistance with above-average volume. Add confirmation like a lower close or break of short-term support before entering.
What is the engulfing pattern in Japanese candlestick theory?
In traditional Japanese analysis, the engulfing pattern is known as a signal of trend exhaustion. It’s a visual representation of one side completely dominating the other within a single period, reflecting a decisive change in trader sentiment.
Who discovered the engulfing candlestick pattern?
It originates from early Japanese rice traders who developed candlestick charting centuries ago. The pattern wasn’t attributed to one individual but was part of the collective knowledge that shaped modern technical analysis.
Is the engulfing pattern still relevant in algorithmic trading?
Yes. Many algorithmic systems use engulfing formations as part of rule-based strategies. Computers can quickly scan for these shapes, combine them with volume or volatility filters, and trigger trades automatically when all conditions align.
How does AI or automated trading detect engulfing candles?
AI systems detect engulfing candles through simple logical rules: they compare open and close values of consecutive candles and confirm when one body fully covers the other. Machine learning models may also consider other features, like volume or volatility, to evaluate the pattern’s significance.
Are engulfing patterns visible in Heikin-Ashi charts?
They can appear, but not exactly the same as on standard candlestick charts. Since Heikin-Ashi candles are averaged, engulfing shapes may look smoother and sometimes form with delay. Traders often switch to regular candles to verify the signal before acting.
Can engulfing patterns appear during news events or high volatility?
Yes, and they often do. Sudden news or economic releases can trigger sharp reversals that create engulfing candles. However, these setups are riskier because the move is driven by temporary emotion or liquidity imbalances rather than steady sentiment.
How to combine the engulfing pattern with other chart patterns like doji, hammer, or shooting star?
Engulfing patterns can complement these signals. For instance, a doji or hammer showing indecision followed by an engulfing candle confirms that control has shifted. When multiple reversal patterns appear together at key levels, they provide stronger evidence that the market is ready to turn.
Geri dön Geri dön
