What is a doji candle?
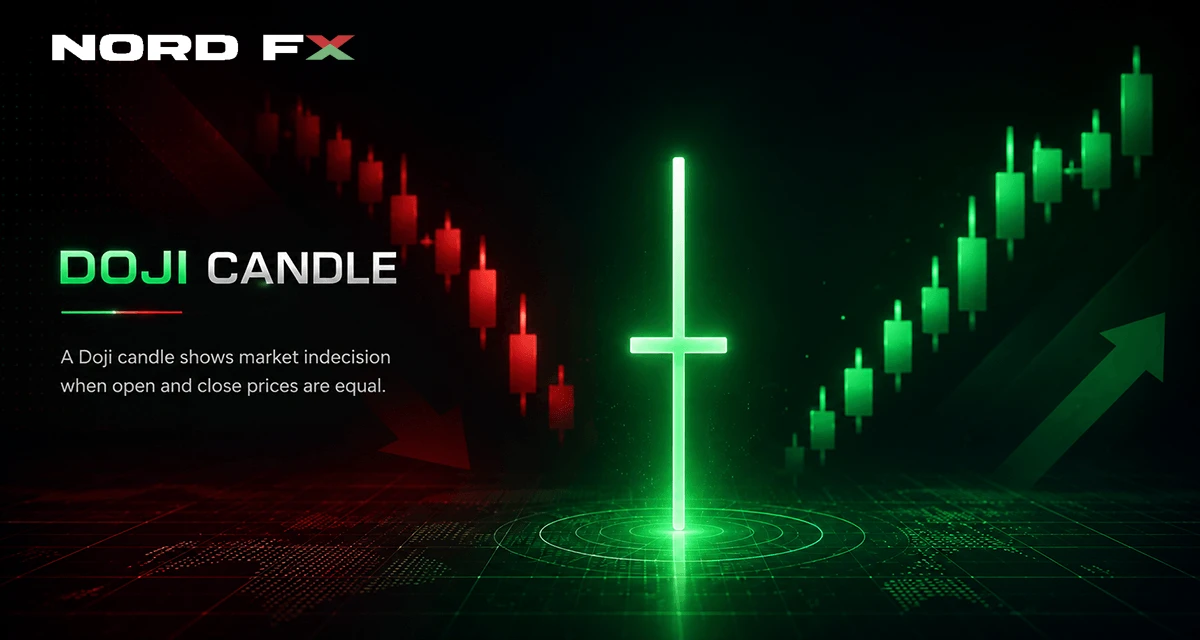
A doji candle forms when a session's opening and closing prices are equal, leaving the candle with virtually no body. It signals market indecision — neither buyers nor sellers won by the close. The trading signal depends on context: where the doji appears, the prior trend, and what the next candle does.
A doji candle = open price = close price. The body is minimal or nonexistent. Shadows extend above and below. It signals indecision.
A doji candle forms when a session's opening and closing prices are the same — or close enough that the candle has virtually no body. What remains is a cross or plus-sign shape made up of upper and lower shadows (wicks). In technical analysis, the doji is a recognized signal of market indecision: buyers and sellers fought through the session but neither side won.
On its own, a doji does not tell you which direction the market will move next. What it tells you is that a battle took place and the result was a draw — and that the next candle will often break the tie.
This guide covers everything: what a doji candle is, how the five main types differ, how to read one correctly, and how to build a practical strategy around it — with examples from gold (XAU/USD), silver (XAG/USD), and Bitcoin.
What Is a Doji Candle?
A doji candle is a candlestick with an opening price and closing price that are equal — or nearly equal — leaving the candle with almost no real body. The upper and lower shadows (wicks) show how far price travelled during the session in each direction before returning to the open level.
The word "doji" comes from Japanese and translates roughly as "the same time" or "simultaneously" — reflecting the fact that buyers and sellers finished at the same point.
Doji candles appear on all markets and timeframes. They are equally visible on a gold daily chart, a Bitcoin 4-hour chart, or a silver 1-hour chart on MT4 or MT5. The pattern itself is easy to spot once you know its shape — what separates skilled traders from beginners is knowing when the pattern actually matters.
How a Doji Forms: The Mechanics Behind the Pattern
To understand why a doji matters, it helps to know exactly what happened during the session that produced it.
Suppose gold opens at $4,300 per ounce. During the session:
- Buyers push price up to $4,318.
- Sellers step in and push price back down to $4,285.
- Buyers recover, bringing price back up.
- The session closes at $4,301 — nearly where it opened.
The result: a candle with a visible upper wick (the rally to $4,318), a visible lower wick (the drop to $4,285), and almost no body (open and close at $4,300 and $4,301).
This is a doji. The long shadows show that both sides had their moment — but neither held the advantage by the close.
What causes a doji to form in practice?
- A major economic data release with mixed initial read (US CPI, non-farm payrolls, FOMC statement)
- Price reaching a level the market has rejected before (previous high, round number, key moving average)
- Low-liquidity conditions where neither side can build momentum
- Conflict between short-term and long-term market participants at the same level
On gold and silver, doji candles frequently appear around Federal Reserve meeting outcomes, dollar index turning points, and geopolitical events where traders are genuinely uncertain about direction.
The Five Doji Types — and What Each One Signals
Not all doji candles look the same. The structure of the wicks determines the type — and each type carries a different implication.
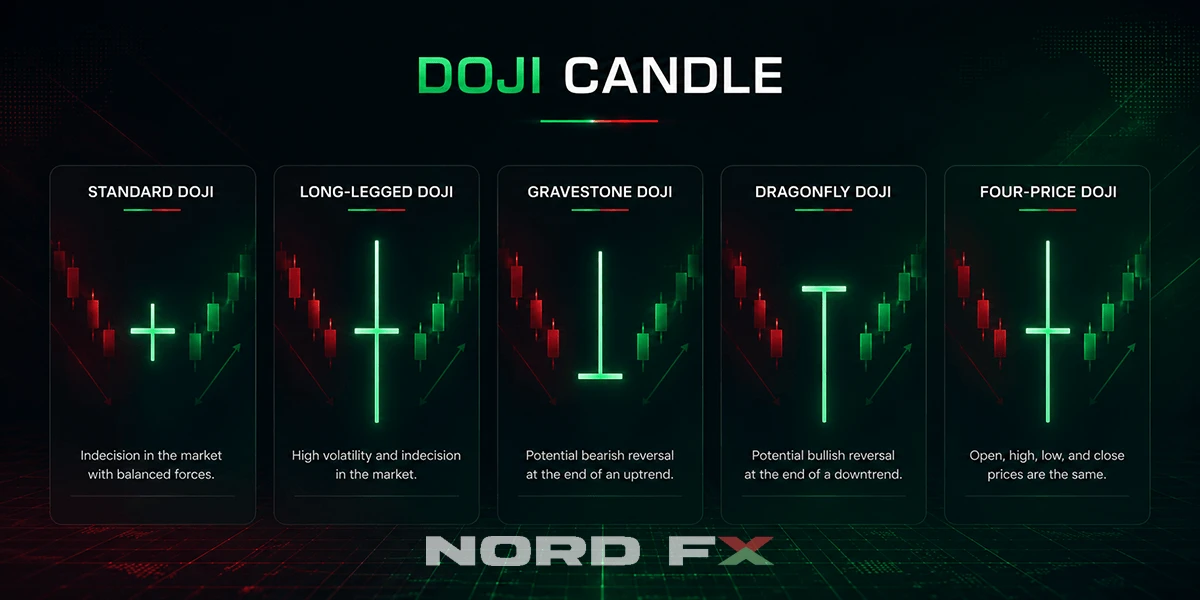
Standard Doji
Open and close are equal. Upper and lower wicks are roughly the same length. Pure indecision with no directional hint from the shadow structure. The most common type — appears frequently in ranging markets or during quiet sessions.
Long-Legged Doji
Very long wicks extending both above and below a tiny body. Price swung sharply in both directions during the session but closed where it opened. This is the most dramatic doji type — it signals extreme uncertainty. On Bitcoin and gold, long-legged doji candles frequently precede large directional moves once the market finally picks a direction.
Gravestone Doji
The open and close are at or near the session's low. There is a long upper shadow and little or no lower shadow. Price was pushed significantly higher during the session, but sellers drove it all the way back down to the open level by the close.
Signal: Bearish. Particularly meaningful at resistance levels or after a sustained uptrend. The gravestone pattern says: buyers tried to push higher, but sellers completely rejected the move.
Dragonfly Doji
The open and close are at or near the session's high. There is a long lower shadow and little or no upper shadow. Sellers drove price down hard during the session, but buyers recovered all of the losses and closed at the open level.
Signal: Bullish. Particularly meaningful at support levels or after a sustained downtrend. The dragonfly says: sellers tried to push lower, but buyers completely rejected the move.
Four-Price Doji
Open, high, low, and close are all the same. The candle appears as a flat horizontal line. Rare — only appears in very thin markets or on unusual timeframes. Not relevant for trading gold, silver, or crypto in normal conditions.
Type | Shadow structure | Signal bias | Most meaningful |
Standard | Equal, moderate | Neutral | At support/resistance |
Long-legged | Very long both sides | Strong indecision | After any trend |
Gravestone | Long upper, no lower | Bearish | At highs, after uptrend |
Dragonfly | Long lower, no upper | Bullish | At lows, after downtrend |
Four-price | None | Inactive market | Rarely applicable |
How to Read a Doji: Context Is Everything
A doji candle on its own has limited value. The same shape can appear at a major turning point or in the middle of random noise. What determines whether a doji is meaningful or not comes down to four factors:
1. The trend before the doji
A doji after a strong directional move carries more weight than one in a sideways range. If gold has rallied five sessions in a row and a gravestone doji appears, that is a notable signal. If a standard doji appears during a choppy sideways week with no clear direction, it tells you very little.
2. Where the doji appears on the chart
Price location is critical. A doji at a previous swing high, at a round number ($4,000, $4,500 on gold; $65,000 on Bitcoin), at a Fibonacci retracement level, or at a moving average carries significantly more weight than one appearing in open space with no reference level nearby.
3. The doji type relative to the situation
Match the type to the context. A gravestone doji at the top of an uptrend is a coherent bearish signal — the structure confirms the location. A dragonfly doji at the top of an uptrend is less meaningful — the structure (bullish) conflicts with the bearish location hypothesis.
4. The confirmation candle
This is the most important factor. Never act on a doji before the following candle closes. The doji itself is a question mark. The next candle is the answer.
- A bearish close after a doji at resistance = bearish confirmation. The reversal signal is active.
- A bullish close that breaks above the doji's high = the doji failed. Trend likely continues.
Traders who act the moment a doji appears — before confirmation — take on significantly more risk and experience more false signals.
How to Trade a Doji: Step-by-Step
This is a practical framework. No single pattern guarantees an outcome — every trade carries risk. The goal of this process is to find situations where multiple factors align, improving the probability of a successful read.
Step 1: Establish the prior trend
Look at 20–50 candles to the left of the doji. Is the market clearly trending up, trending down, or moving sideways? A doji at the end of a clear trend is more significant than one in a ranging market.
Step 2: Identify the location
Mark key price levels before anything else. These include:
- Previous swing highs and lows
- Round numbers significant to the asset
- Fibonacci retracement levels from the most recent significant swing
- 50-day or 200-day moving averages
If the doji forms exactly at one of these levels, proceed to step 3.
Step 3: Match the doji type to the scenario
- Bearish scenario (resistance after uptrend): gravestone doji is the strongest signal. Standard doji is acceptable. Long-legged doji needs confirmation. Dragonfly doji here is a weak signal.
- Bullish scenario (support after downtrend): dragonfly doji is the strongest signal. Standard doji is acceptable. Long-legged doji needs confirmation.
Step 4: Wait for the confirmation candle
After the doji closes, wait for the next full candle to close. Do not act during it — wait for its close.
- For a bearish trade: the confirmation candle must close below the doji's low.
- For a bullish trade: the confirmation candle must close above the doji's high.
If the confirmation candle closes in the opposite direction (breaks the doji's high in a bearish setup, or its low in a bullish setup), the doji has failed. Skip the trade.
Step 5: Set entry, stop, and target
Once confirmation is in:
- Entry: Open the position at the start of the candle after confirmation, or use a limit order.
- Stop-loss: Place it just beyond the doji's extreme. For a short: just above the doji's high. For a long: just below the doji's low. On gold, allow $2–5 per ounce beyond the level. On Bitcoin, allow 1–2% beyond the level.
- Profit target: Set at the next significant support (for shorts) or resistance (for longs). Aim for a minimum 1:2 risk-to-reward ratio. If the math does not give you at least 1:2, skip the trade.
- Position size: Calculate based on your stop distance and maximum acceptable risk per trade (typically 1–2% of account balance).
On MT4 and MT5, use horizontal lines to mark the doji's high and low before entering. Set stop and take-profit in the order window at the time of entry — not after the trade is running.
Common Mistakes Traders Make With Doji Patterns
Acting before confirmation. The most frequent error. The doji looks perfect, the trader enters immediately — then the next candle makes one more push in the original trend direction, stopping them out. Always wait for the next candle to close.
Trading doji in ranging markets. In a sideways market, doji candles appear constantly and are meaningless. They only carry weight after a clear directional move.
Ignoring the doji type. A gravestone doji and a dragonfly doji are structurally opposite signals. Using the same trading logic for both is an error. Match the type to the context.
Setting stops too tight on volatile assets. Gold and Bitcoin move faster and further than major currency pairs. A stop placed 0.5% from the doji extreme will often be hit by normal intraday noise before the trade develops. Use the asset's typical daily range as a guide for stop placement.
Skipping the risk:reward calculation. A doji setup with a 1:1 ratio is not worth taking regardless of how good the pattern looks. Calculate stop size and target distance before entering. The math determines whether you trade, not the visual alone.
Treating a failed doji as a loss to recover. When a doji fails (price breaks through the extreme in the trend direction), that is useful information — the trend is stronger than the pattern suggested. Move on. Do not double down or revenge trade.
Doji vs Spinning Top: What Is the Difference?
Both doji and spinning top candles appear in similar situations and signal similar things — indecision. The structural difference is small but important.
Feature | Doji | Spinning Top |
Real body | Virtually nonexistent | Small but visible |
Open vs close | Equal or nearly equal | Different, but close |
Shadows | Variable | Both present |
Indecision strength | Stronger | Moderate |
A spinning top has a small real body — meaning one side had a slight edge by the close. A doji has no body — the result was a complete draw.
In practice, both are treated similarly. The doji carries slightly more weight because the indecision was more exact. When a doji and a spinning top appear at the same level in sequence, many traders treat the combination as a stronger signal than either alone.
Conclusion
A doji candle marks a moment when the market could not decide. It is neither bullish nor bearish by itself — but placed at the right level, after the right trend, and confirmed by the following candle, it becomes one of the more reliable reversal signals available to a technical trader.
The rules to keep:
- Identify the trend before the doji.
- Check whether the doji appears at a meaningful level.
- Match the doji type to the situation.
- Wait for confirmation before acting.
- Calculate stop and target before entering — skip any setup where the math doesn't work.
Doji candles appear across all the markets available at NordFX — gold, silver, oil, Bitcoin, currencies, and more — on MT4 and MT5.
FAQ
What does a doji candle mean?
A doji candle means the market opened and closed at the same price — buyers and sellers were in exact balance for that session. It signals indecision. The direction of the next move depends on context: where the doji appeared, what the trend was before it, and what the following candle does.
Is a doji candle bullish or bearish?
A standard doji is neutral. The directional read depends on context and type. A gravestone doji at resistance after an uptrend has bearish implications. A dragonfly doji at support after a downtrend has bullish implications. Without context, a doji alone is neither.
What happens after a doji candle?
Two things can happen: the market reverses (the doji was a turning point) or the trend continues (the doji was a brief pause). The following candle determines which. A strong close in the reversal direction confirms the signal. A close that breaks through the doji's high or low in the trend direction cancels it.
How reliable is a doji candle?
Reliability improves significantly when three factors align: the doji appears after a clear trend, it forms at a meaningful price level (support, resistance, round number, Fibonacci zone), and the following candle confirms the expected direction. In isolation, or in choppy sideways markets, doji candles produce frequent false signals.
What is the difference between a gravestone doji and a dragonfly doji?
A gravestone doji closes at the session low with a long upper shadow — sellers rejected a push higher. It is a bearish signal at highs. A dragonfly doji closes at the session high with a long lower shadow — buyers rejected a push lower. It is a bullish signal at lows. They are structural opposites.
Can I use a doji candle to trade gold or Bitcoin?
Yes. Doji candles are particularly visible on gold (XAU/USD), silver (XAG/USD), and Bitcoin charts because these markets trend strongly and react sharply to catalysts. The same reading framework applies: identify the trend, check the level, match the doji type, wait for confirmation. On Bitcoin, use daily or 4-hour charts — shorter timeframes generate too much noise to be reliable.
How do I set a stop-loss on a doji trade?
Place your stop-loss just beyond the doji's extreme: above the doji's high for short trades, below the doji's low for long trades. On volatile assets like gold, allow a small buffer (a few dollars per ounce) beyond the exact level to account for normal spread and noise. Set the stop in the MT4/MT5 order window at the time of entry.
Geri dön Geri dön
