First, a review of last week’s forecast:
- Speaking of the EUR/USD last week, analysts were not able to give a clear forecast. Indeed, the pair behaved quite sluggishly, and neither the meeting of the ECB, nor the speech of the Head of the Fed, nor even the Trump administration’s landmark vote in the US Congress on the healthcare reform and repeal of Obamacare, could make it more dynamic. The pair's volatility kept within 100 points. As it turned out, the most accurate forecast was given by graphic analysis, denoting a strong support at the 1.0700 horizon (in reality, the pair dropped to 1.0720) and the 1.0850 resistance (in reality, there followed a rise to 1.0824);
- Regarding the forecast for GBP/USD, the alternative scenario occurred, supported by 35% of the experts. As they expected, the pair continued the upward trend and climbed up to 1.2530, and came close to the highs of this February;
- USD/JPY. Here, graphical analysis, along with 40% of analysts, expected a fall of the pair to the lows of February-March in the area of 111.60. However, the bears’ striving towards the south was so strong that they were able to break through this support and push down the pair by another 100 points. After that the bears ran out of strength, and the pair passed into the sideways trend within the range 110.62-111.57;
- Evaluating the future of the pair USD/CHF, most experts agreed that it would continue to decline to the area of 0.9870-0.9900, and this forecast was correct by 100%. On Wednesday 22nd March the pair reached the local bottom at 0.9880, and completed the week-long session at around 0.9911.
Forecast for the coming week:
Summarizing the views of a number of analysts from leading banks and brokerage firms, as well as the forecasts made on the basis of a wide variety of technical and graphical analysis methods, we can say the following:
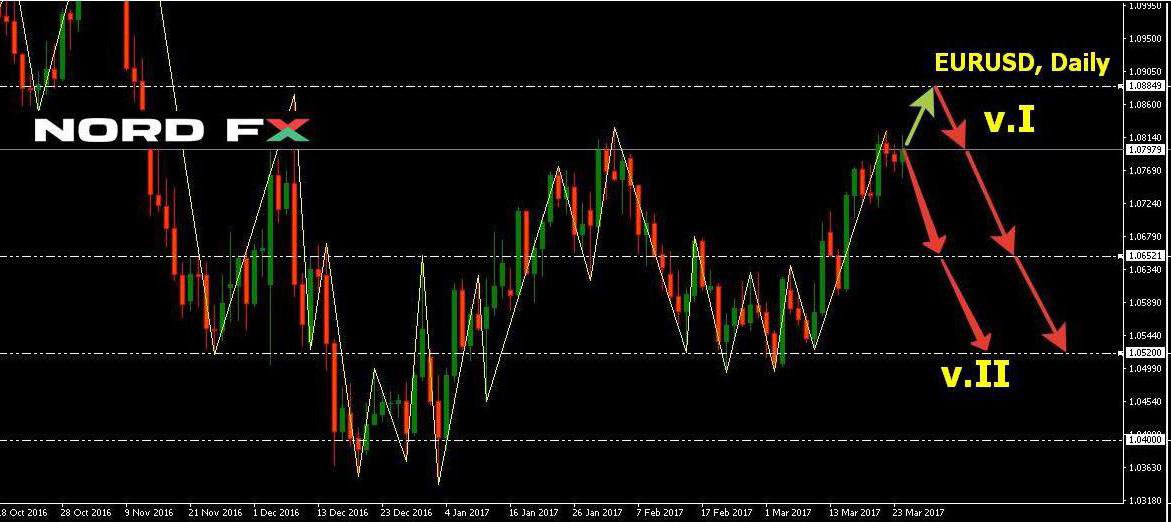
- EUR/USD. At the end of last week, the pair almost reached the upper border of the corridor, which was launched back in November 2016. That is why most experts (60%), supported by graphical analysis and oscillators on D1, believes that a further growth of the pair, although possible, will be negligible, and, having reached the 1.0850-1.0900 area, it is sure to make a U-turn towards the south. According to the remaining 40% of analysts, the bulls have run out of strength and in the next week the pair is expected to decrease first to the level of 1.0650, and then even lower - to the support of 1.0520;

- A similar forecast can be made for the GBP/USD. It is possible that for some time the pair may stay in the range of 1.2420-1.2570, but then, according to 85% of analysts, it will fall to the March lows in the 1.2100-1.2200 area. One should bear in mind that on Wednesday March 29th the British government is expected to launch the Brexit process and the reaction of major players in the market at that point in time could produce some surprises to traders;
- When forecasting the future of USD/JPY, indicators, supported by graphical analysis on D1, vote for the downward trend to continue and for the pair to go down to the 108.00-109.00 zone. As for the experts, opinions are divided equally – half support the fall, while half support the growth of the pair. If we take a look at the medium-term forecast, supporters of the movement to the north prevail significantly - about 75% of analysts vote for the pair's return to the upper boundary of the 2017 sideways channel at the height of 115.00-115.50;
- As for the USD/CHF pair, both experts and graphical analysis expect that it will continue to mirror the behaviour of EUR/USD. Thus, it is not excluded to temporarily go down to the 0.9860-0.9880 zone with a subsequent rise in an attempt to reach a height of 1.0330. About 70% of analysts voted for such a scenario.
Roman Butko, NordFX
Go Back Go Back
