Tổng Quan Chung Về Tuần Qua và Tuần Tới
Thị trường kết thúc tuần trong tâm trạng hỗn hợp khi các nhà tham gia cố gắng tiêu hóa cả việc kết thúc đợt đóng cửa chính phủ Mỹ kéo dài kỷ lục 43 ngày và sự không chắc chắn ngày càng tăng xung quanh động thái tiếp theo của Cục Dự trữ Liên bang. Việc đóng cửa chính thức kết thúc vào ngày 12 tháng 11 và các cơ quan liên bang hiện đang xây dựng lại lịch trình cho dữ liệu kinh tế bị trì hoãn, điều này có nghĩa là các số liệu tháng 10 về tăng trưởng, việc làm và chi tiêu sẽ nhỏ giọt ra với độ trễ và có thể có khoảng trống. Điều này làm phức tạp nhiệm vụ của Fed vào thời điểm lạm phát hàng năm của Mỹ đang dao động quanh mức 3,0% và vẫn cao hơn mục tiêu 2%.
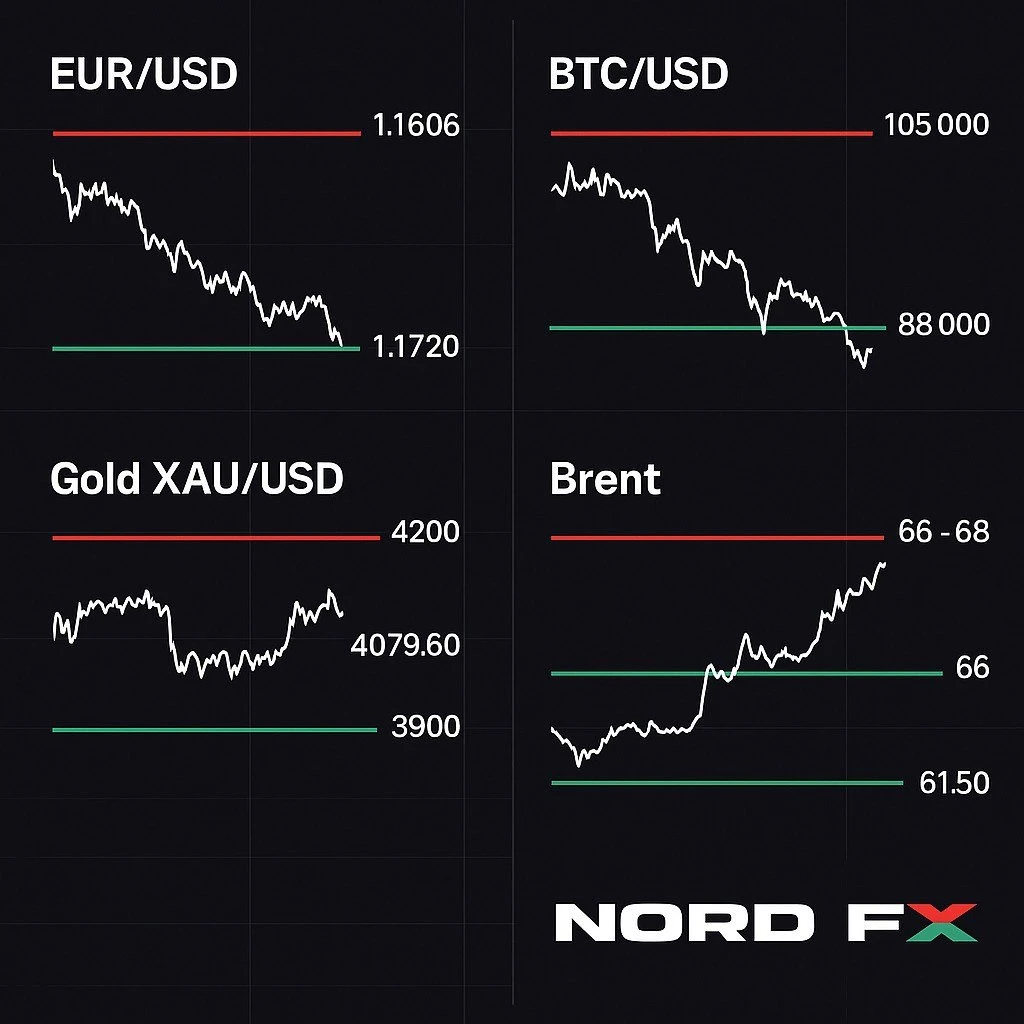
Hợp đồng tương lai dầu Brent đã chốt phiên vào thứ Sáu gần 64 USD/thùng, duy trì trong một kênh giảm rộng mặc dù có sự phục hồi khiêm tốn từ mức thấp giữa tuần. Vàng đóng cửa phiên quanh mức 4.079,60 USD/ounce sau khi giao dịch trong khoảng từ khoảng 4.032 USD đến 4.212 USD trong ngày, vẫn không xa dưới mức cao kỷ lục gần đây.
Trong lĩnh vực tiền điện tử, bitcoin đã kéo dài sự điều chỉnh từ đỉnh tháng 10. Đồng tiền này đã giảm xuống mức thấp khoảng 94.000 USD vào thứ Sáu và kết thúc ngày gần 94.500 USD. Vào thứ Bảy, nó đang giao dịch lại gần 96.000 USD, nhưng vẫn thấp hơn hơn 10% so với mức cao trên 110.000 USD được thấy vào cuối tháng 10.
Nhìn về phía trước trong tuần từ 17-21 tháng 11, các nhà giao dịch sẽ tập trung vào một lịch trình sự kiện dày đặc. Các mục quan trọng bao gồm CPI của Canada vào thứ Hai, biên bản cuộc họp tháng 10 của Fed vào thứ Tư ngày 19 tháng 11, các quyết định lãi suất ở châu Á và một loạt các chỉ số PMI nhanh cho khu vực đồng euro, Anh và Mỹ vào cuối tuần. Với khả năng cắt giảm lãi suất của Fed thêm một lần nữa tại cuộc họp ngày 9-10 tháng 12 hiện gần như là một trò tung đồng xu, bất kỳ gợi ý nào từ biên bản hoặc PMI có thể kích hoạt các động thái mạnh mẽ trong đồng đô la, lợi suất và tài sản rủi ro.
EUR/USD
EUR/USD đóng cửa vào thứ Sáu ở mức 1,1606 sau khi giao dịch trong phạm vi nội ngày 1,1606-1,1654 và chỉ ghi nhận một khoản lỗ nhỏ hàng tuần. Trên biểu đồ hàng ngày, cặp tiền này vẫn nằm trên đường trung bình động 50 ngày của nó và tiếp tục di chuyển trong một mô hình Tam giác trung hạn đã hình thành từ cuối mùa hè. Người mua vẫn đang bảo vệ vùng hỗ trợ 1,1490-1,1520, trong khi các chỉ báo động lượng chỉ ra lực tăng đang mờ dần khi RSI tiếp cận một đường xu hướng giảm từ mức cao tháng 7.
Trong tuần tới, một nỗ lực mới để kiểm tra kháng cự trong khu vực 1,1720-1,1760 vẫn có thể xảy ra nếu biên bản Fed được hiểu là thận trọng và nếu các chỉ số PMI nhanh không cho thấy sự suy giảm mạnh trong hoạt động của khu vực đồng euro. Tuy nhiên, với tăng trưởng khu vực đồng euro chỉ ổn định, lạm phát của Mỹ gần 3% và các quan chức Fed công khai chia rẽ về việc có cần cắt giảm thêm vào tháng 12 hay không, một sự bứt phá bền vững cao hơn có thể sẽ yêu cầu một tín hiệu rõ ràng hơn rằng chính sách của Mỹ đang chuyển hướng quyết định hơn về phía ôn hòa.
Một sự phá vỡ dưới 1,1490 sẽ lộ ra khu vực 1,1365 và tăng nguy cơ điều chỉnh sâu hơn về mức thấp đầu tháng 10. Mặt khác, một đóng cửa hàng ngày trên 1,2060 sẽ báo hiệu một sự bứt phá tăng giá được xác nhận từ sự hợp nhất trung hạn và mở đường về phía dải 1,22-1,23.
Quan điểm cơ bản: xu hướng tăng nhẹ trong khi EUR/USD vẫn trên 1,1490, với khả năng đẩy vào vùng 1,17, nhưng với rủi ro đáng kể của các đợt điều chỉnh nếu truyền thông của Fed hoặc dữ liệu của Mỹ thay đổi tâm lý trở lại có lợi cho đồng đô la.
Bitcoin (BTC/USD)
bitcoin đã có một tuần biến động khác. Sau khi giao dịch trên 105.000 USD vào đầu tháng 11, đồng tiền này hiện đã rõ ràng chuyển sang giai đoạn điều chỉnh. Vào thứ Sáu, BTC/USD giảm xuống khoảng 94.000 USD trước khi đóng cửa gần 94.500 USD. Vào thứ Bảy, nó đang dao động gần 96.000 USD theo các sàn giao dịch lớn, vẫn thấp hơn nhiều so với mức cao tháng 10 khoảng 125.000-126.000 USD. Động thái này được thúc đẩy bởi nhu cầu ETF giảm nhiệt, kỳ vọng giảm về việc nới lỏng mạnh mẽ của Fed và một làn sóng chốt lời sau đợt tăng mạnh trong năm nay.
Về mặt kỹ thuật, bitcoin đã phá vỡ khỏi kênh tăng giá dốc của nó và hiện đang giao dịch trong một kênh giảm hoặc điều chỉnh rộng hơn. Các đường trung bình động ngắn hạn đã bắt đầu quay đầu, và RSI 14 ngày bị mắc kẹt dưới phạm vi trung bình, xác nhận sự mất động lực tăng. Kháng cự gần nhất hiện nằm trong khu vực 102.000-105.000 USD, nơi hỗ trợ trước đó, đường trung bình động 50 ngày và một đường xu hướng giảm hội tụ gần như.
Nếu giá không thể phá vỡ khu vực này và người bán giành lại quyền kiểm soát, một sự suy giảm mới về phía 92.000 USD và sau đó là 88.000-85.000 USD không thể bị loại trừ, đặc biệt nếu khẩu vị rủi ro xấu đi sau biên bản Fed. Ngược lại, một động thái bền vững trở lại trên 115.000 USD sẽ báo hiệu rằng sự điều chỉnh có khả năng kết thúc và có thể mở đường cho một nỗ lực khác tại các đỉnh tháng 10 gần 125.000-126.000 USD.
Quan điểm cơ bản: trung lập đến giảm giá trong khi BTC/USD giao dịch dưới dải kháng cự 102.000-105.000 USD và, đặc biệt, dưới 100.000 USD. Các đợt phục hồi ngắn hạn có thể xảy ra, nhưng hiện tại chúng trông giống như các đợt phục hồi điều chỉnh hơn là sự khởi đầu của một xu hướng tăng mới.
Dầu thô Brent
Hợp đồng tương lai dầu thô Brent đã kết thúc phiên thứ Sáu gần 64 USD/thùng, phục hồi một phần các khoản lỗ đã thấy trước đó trong tuần nhưng vẫn giao dịch về phía nửa dưới của phạm vi đã chi phối từ quý 2. Giá vẫn nằm trong một kênh giảm rộng, và người bán dường như sẵn sàng tái xuất hiện khi tiếp cận khu vực 66-68 USD.
Bức tranh cơ bản vẫn còn hỗn hợp. Một mặt, lo ngại về nguồn cung định kỳ bùng phát do rủi ro địa chính trị và các sự cố cơ sở hạ tầng, điều này hỗ trợ giá vào những ngày khi tiêu đề trở nên tiêu cực. Mặt khác, lo ngại về nhu cầu toàn cầu và tác động của lãi suất thực vẫn cao giữ cho các nhà đầu tư dài hạn thận trọng, với các đường cong kỳ hạn và dữ liệu định vị cho thấy chỉ có sự tự tin thận trọng vào một sự phục hồi bền vững.
Trong ngắn hạn, một động thái điều chỉnh cao hơn về phía 66-67 USD là có thể nếu tâm lý cải thiện và nếu dữ liệu tồn kho hàng tuần của Mỹ cho thấy nhu cầu mạnh hơn hoặc giảm mạnh hơn. Tuy nhiên, một đóng cửa hàng ngày dưới vùng hỗ trợ 62-61,50 USD sẽ cho thấy áp lực giảm giá đang mạnh lên trở lại và có thể mở đường về phía 58 USD và ranh giới dưới của kênh giảm. Chỉ một sự tiến bộ bền vững trên 70-71 USD mới rõ ràng chỉ ra rằng một sự đảo chiều xu hướng tăng bền vững hơn đang diễn ra với các mục tiêu tiềm năng gần 76 USD.
Quan điểm cơ bản: trung lập đến giảm giá trong khi Brent giao dịch dưới khoảng 68 USD, với các đợt phục hồi về phía kháng cự có khả năng thu hút sự quan tâm bán trừ khi dữ liệu vĩ mô sắp tới chỉ ra một sự phục hồi mạnh mẽ hơn trong nhu cầu toàn cầu.
Vàng (XAU/USD)
Hợp đồng tương lai vàng đã chốt phiên thứ Sáu ở khoảng 4.079,60 USD/ounce, sau một phạm vi nội ngày từ khoảng 4.032 USD đến 4.212 USD. Điều này đánh dấu sự giảm giá hàng tuần thứ hai liên tiếp từ vùng kỷ lục gần đây trên 4.300 USD nhưng vẫn để lại xu hướng tăng rộng hơn còn nguyên vẹn. XAU/USD vẫn đang giao dịch trong một kênh tăng rộng trên biểu đồ hàng ngày, được hỗ trợ bởi gánh nặng nợ thực cao về mặt cấu trúc, lo ngại tài khóa kéo dài và nhu cầu từ các nhà đầu tư tìm kiếm một biện pháp phòng ngừa lạm phát vẫn quanh mức 3% ở Mỹ và cao ở nhiều nền kinh tế khác.
Về mặt kỹ thuật, kim loại này đang củng cố trên một dải hỗ trợ quan trọng trong khu vực 3.950-3.900 USD, nơi các mức đột phá trước đó và đường trung bình động 50 ngày tập trung. Các chỉ báo động lượng đã giảm từ vùng quá mua, cho phép xu hướng tăng nguội đi mà chưa báo hiệu một sự đảo chiều lớn. Một sự giảm sâu hơn về phía 3.865 USD không thể bị loại trừ nếu đồng đô la mở rộng sự phục hồi của nó hoặc nếu lợi suất thực tăng cao hơn, nhưng ở giai đoạn này, những sự giảm giá như vậy có khả năng được coi là cơ hội để tái nhập các vị thế dài hơn là một sự thay đổi xu hướng rõ ràng.
Về phía tăng, xác nhận rằng sự điều chỉnh đã kết thúc có khả năng đến từ một đóng cửa hàng ngày trở lại trên vùng kháng cự 4.165-4.200 USD. Trong trường hợp đó, các mục tiêu tiếp theo sẽ nằm trong phạm vi 4.250-4.300 USD và sau đó là các mức cao kỷ lục gần đây hơi trên 4.380 USD. Một sự sụp đổ và di chuyển bền vững dưới 3.535 USD sẽ cần thiết để vô hiệu hóa kịch bản tăng giá trung hạn và chỉ ra một sự đảo chiều sâu sắc hơn.
Quan điểm cơ bản: xu hướng mua khi giảm giá trong khi XAU/USD giữ trên khoảng 3.900 USD, với chân tiềm năng tiếp theo cao hơn phụ thuộc vào cách biên bản Fed và dữ liệu Mỹ bị trì hoãn ảnh hưởng đến kỳ vọng về lãi suất thực và đồng đô la.
Kết Luận
Tuần từ 17-21 tháng 11 mở ra với các thị trường đang cố gắng tìm kiếm định hướng sau đợt đóng cửa chính phủ Mỹ lịch sử và trước các tín hiệu quan trọng từ ngân hàng trung ương. Bức tranh lạm phát của Mỹ vẫn không thoải mái, với CPI tiêu đề quanh mức 3% so với cùng kỳ năm trước và các quan chức Fed chia rẽ về việc có cần cắt giảm lãi suất thêm vào cuộc họp ngày 9-10 tháng 12 hay không. Đồng thời, lịch trình phát hành dữ liệu tháng 10 đang được xây dựng lại, điều này thêm một lớp không chắc chắn khác cho các nhà giao dịch.
Trong môi trường này, EUR/USD tiếp tục giao dịch trong một phạm vi rộng, với cả phe mua và phe bán đều không thể giành được chiến thắng quyết định. Vàng đang tạm dừng sau khi thiết lập các kỷ lục mới nhưng vẫn được hỗ trợ khi giảm giá, trong khi Brent vẫn bị giới hạn bởi lo ngại về nhu cầu toàn cầu. bitcoin, cuối cùng, đã nhắc nhở các nhà tham gia thị trường về mức độ nhạy cảm của các tài sản beta cao đối với sự thay đổi trong kỳ vọng lãi suất và điều kiện đòn bẩy, giảm mạnh từ đỉnh của nó khi các nhà giao dịch tính đến khả năng quyết định của Fed vào tháng 12 không còn là một cược một chiều.
Như mọi khi, các nhà giao dịch nên duy trì sự linh hoạt, theo dõi các mức kỹ thuật quan trọng được nêu ở trên và theo dõi chặt chẽ các phát hành vĩ mô sắp tới, đặc biệt là biên bản Fed và các chỉ số PMI nhanh. Sự biến động có thể tăng nhanh nếu bất kỳ tín hiệu nào trong số này thay đổi đáng kể kỳ vọng về chính sách tiền tệ hoặc tăng trưởng toàn cầu.
Nhóm Phân Tích NordFX
Tuyên bố miễn trừ trách nhiệm: Các tài liệu này không phải là khuyến nghị đầu tư hoặc hướng dẫn làm việc trên thị trường tài chính và chỉ nhằm mục đích thông tin. Giao dịch trên thị trường tài chính có rủi ro và có thể dẫn đến mất hoàn toàn số tiền đã gửi.

