Price rarely moves in a straight line. Even the strongest trends pause, breathe, and “go quiet” before the next meaningful move begins. That quiet phase is often price consolidation - a period when the market trades within a relatively narrow range as buying and selling pressure temporarily balance out.
Consolidation is not “nothing happening”. It is the market processing the last impulse, redistributing risk, absorbing orders, and waiting for fresh information or liquidity. Traders who understand consolidation can avoid low-probability trades inside choppy ranges and instead position for the moment when price leaves the range with intent.
This article explains what price consolidation is, why it forms, how to identify it across timeframes, and practical approaches for trading it without relying on guesswork. More educational materials on how markets behave across different conditions can be found in the NordFX Useful Articles section.
What is price consolidation?
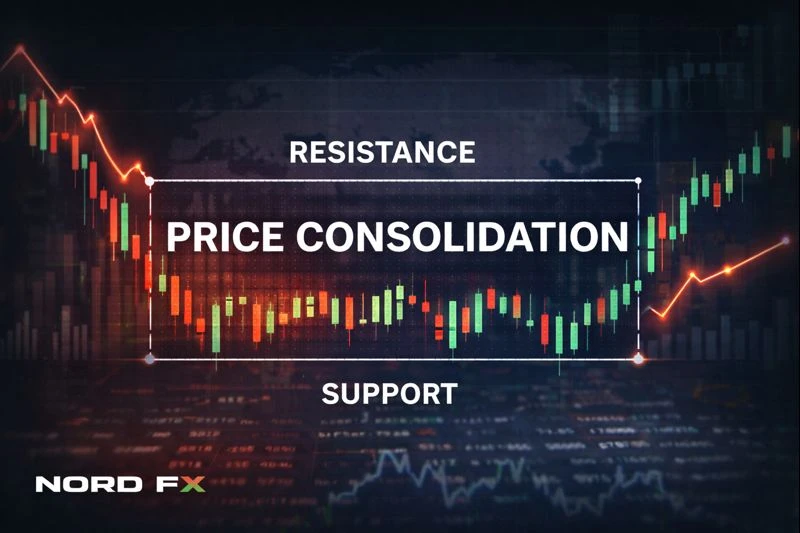
Price consolidation is a market phase characterised by sideways movement and reduced directional progress after a prior move (up or down), or during uncertainty when participants disagree on fair value. Rather than trending, price oscillates between relatively clear boundaries, often called support and resistance.
A simple way to think about it is this: during a trend, one side dominates. During consolidation, dominance fades and a short-term equilibrium develops. The market is still active, but the net result is a compact range.
Consolidation can appear as a clean horizontal “box”, but it also shows up as tighter and tighter swings, compressions, or overlapping candles. The key feature is contraction of movement relative to the prior phase. The key feature is contraction of movement relative to the previous phase, a concept widely discussed in classical technical analysis.
Why does consolidation happen?
Several forces can cause price to consolidate, and they often overlap.
Strong moves attract profit-taking. Traders who rode the trend close positions, reducing momentum and creating a counter-flow of orders. At the same time, late entrants still want to participate but hesitate to buy high or sell low. That creates a standoff where both sides trade, but neither pushes far.
Liquidity also plays a role. Larger participants typically need time and volume to build or unwind positions without moving price too aggressively. A tight range can act as a “liquidity pool” where orders are matched more easily.
Uncertainty is another common driver. Markets consolidate ahead of major events such as central-bank decisions, inflation prints, earnings, or geopolitical headlines. Participants reduce exposure, volatility compresses, and price becomes range-bound until new information resolves expectations. These dynamics are common across all financial markets, including forex, metals, indices, and crypto assets.
Consolidation is, in many cases, the market’s way of saying: the previous direction is no longer effortless, and the next direction is not yet agreed.
The main types of consolidation patterns
Consolidation is a behaviour, not a single shape. Still, traders often group common structures because they reflect how order flow is organised.
A range (rectangle) is the classic form: price bounces between fairly horizontal support and resistance. Ranges can be tight or wide, and they can last from minutes to months.
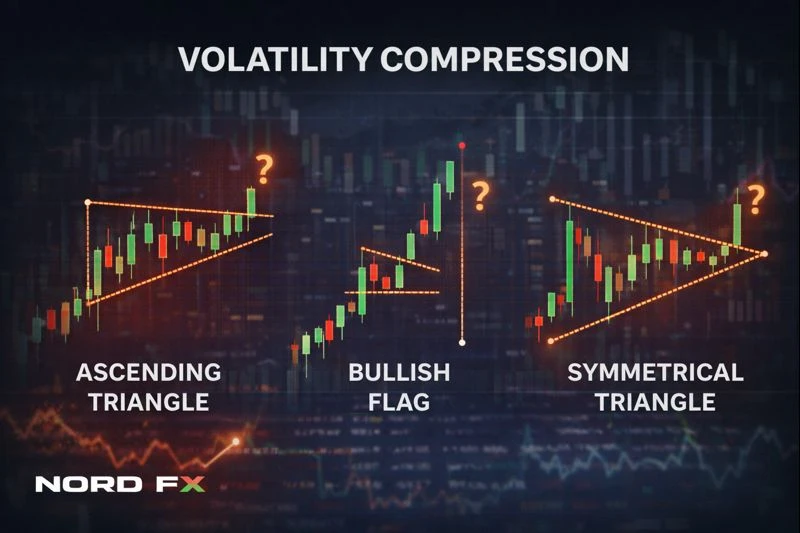
A triangle is a range that narrows over time. Higher lows with lower highs create compression, suggesting that buyers and sellers are gradually accepting a tighter price zone. Breakouts from triangles can be sharp because the market has “stored” energy in the form of reduced volatility.
A flag or pennant is a short consolidation that follows a strong impulse. Flags tend to drift slightly against the impulse direction, while pennants resemble small triangles. These often appear in trend continuation phases, but they are not guaranteed continuation setups.
A wedge is another narrowing structure, typically slanted. Wedges can be continuation or reversal patterns depending on context, speed, and where they appear relative to the larger trend.
Patterns are helpful as visual shorthand, but the practical focus should remain on two questions: where are traders repeatedly defending price, and where does price repeatedly fail? Those areas define the consolidation boundaries.
How to identify consolidation on a chart
The cleanest sign is overlap. Trending price tends to make progress with limited overlap between candles. Consolidating price tends to produce many candles that overlap each other, with repeated rejections near similar highs and lows.
Another sign is contracting volatility. Indicators such as Average True Range (ATR) often decline during consolidation. Bollinger Bands commonly narrow as volatility compresses. When the market is consolidating, the distance travelled per candle shrinks relative to the earlier phase.
Structure also matters. Consolidation is more convincing when boundaries are tested multiple times without being broken. One touch is rarely enough. Two touches may still be coincidence. Three or more reactions at similar levels, especially with visible rejection wicks, often indicates that many traders recognise those areas.
Timeframe alignment helps as well. A consolidation on a small timeframe may simply be noise inside a larger trend. The most tradable consolidations are usually those that are visible on the trader’s decision timeframe and make sense within the higher-timeframe context.
Consolidation vs reversal: how to tell the difference
Consolidation is a pause; reversal is a change in direction. The difference is not always obvious in real time because reversals often begin as consolidations.
Context provides clues. Consolidation that forms after a strong trend can become either continuation or reversal. Continuation tends to show controlled pullbacks, relatively shallow retracements, and frequent defence of the trend-side boundary (for example, higher lows in an uptrend). Potential reversal tends to show failed attempts to resume the trend, heavy rejection near the prior extreme, and increasing success by the opposing side in pushing price through the range.
Volume interpretation can help, but it is instrument-dependent. Broadly speaking, consolidation with declining participation can imply a pause, while consolidation with aggressive reactions at boundaries may indicate distribution or accumulation. Still, volume is more transparent in some markets than others, so it should be used carefully rather than treated as a universal truth.
Instead of trying to predict “this must reverse”, a more robust approach is to define the consolidation boundaries and wait for evidence: a confirmed break and acceptance outside the range, or a clear failure and return inside.
Trading approaches during price consolidation
Consolidations create two broad styles of opportunity: range trading and breakout trading. Each has strengths and risks, and the better choice often depends on volatility, market regime, and the trader’s temperament.
Range trading: buying support and selling resistance
Range trading aims to profit from the market’s tendency to revert within a defined box. The logic is simple: if price has repeatedly bounced from support and repeatedly rejected resistance, trades aligned with those reactions can have favourable risk-to-reward.
The difficulty is that ranges eventually end. A trader who sells resistance “one more time” can be caught when the breakout finally happens. Risk control is therefore central. Stops typically belong outside the boundary, not inside it, because the whole idea of the range fails once price escapes and holds beyond the level.
Range trading also works best when volatility is stable and boundaries are respected cleanly. Choppy, messy consolidations often cause false signals and can grind down results through repeated small losses or whipsaws.
Breakout trading: waiting for expansion after compression
Breakout trading aims to capture the directional move that follows consolidation. Compression often precedes expansion because volatility tends to cycle. When a market stops moving, it does not stay calm forever.
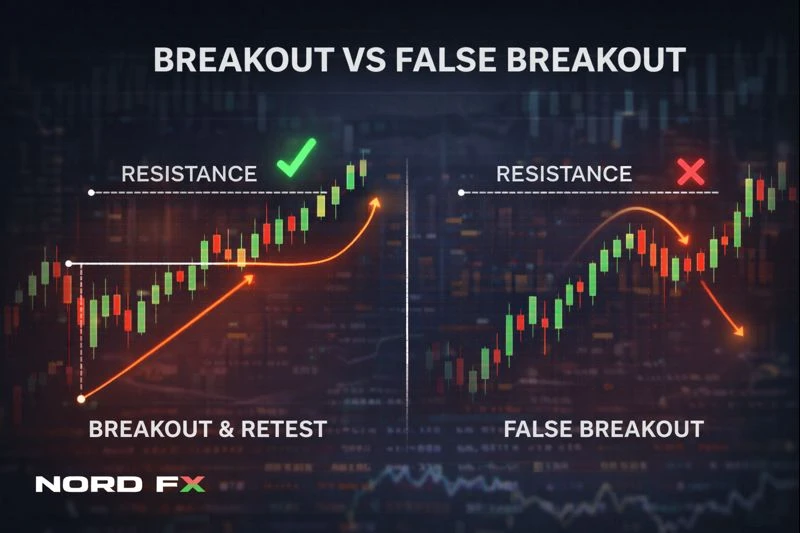
The main challenge is the false breakout. Price can poke outside the range, trigger stops and entries, then snap back inside. Many breakouts fail because the move lacked follow-through or because liquidity was harvested.
One way traders reduce this risk is by waiting for confirmation, such as a candle close outside the range plus additional evidence that the market is “accepting” the new area. Another approach is the breakout-retest method: price breaks out, returns to test the old boundary (now potential support or resistance), then resumes the breakout direction. Retests do not always happen, but when they do, they can offer clearer risk placement.
Breakout trading also benefits from recognising when consolidation is likely to produce a strong move. Tight ranges following strong impulses, multi-touch boundaries, and long compressions on higher timeframes can increase the chance that the next move is meaningful.
A balanced approach: trade less inside, plan more around the edges
Many experienced traders do not try to trade every wiggle inside consolidation. They focus on the boundaries, reduce position size, or simply wait. Consolidation can be a “no trade” zone until price provides a clearer edge.
Patience is a strategy. Avoiding low-quality conditions is often as valuable as finding entries.
Indicators that help confirm consolidation
Indicators are most useful when they reinforce what the chart already shows.
ATR (Average True Range) is a practical tool for measuring contraction. Falling ATR suggests reduced movement, which is typical in consolidation. Traders often use ATR to set realistic stops and targets relative to current conditions.
Bollinger Bands can highlight volatility compression. Narrow bands often coincide with consolidations. A subsequent band expansion can accompany a breakout, though it does not guarantee direction.
Moving averages can reveal when the market has lost trend structure. During consolidation, moving averages tend to flatten, and price crosses them repeatedly. That “tangling” effect often signals that trend-following entries may have lower expectancy until structure returns.
Support and resistance mapping remains the most direct “indicator” of all. If multiple rejections occur at similar levels, those levels matter, regardless of what oscillators say.
Risk management for consolidation trades
Consolidation can tempt traders into overtrading because price appears to offer frequent opportunities. The market may move back and forth just enough to trigger entries but not enough to pay for them. That is why risk management should tighten, not loosen, during range conditions.
Position sizing should reflect the environment. Smaller size can help absorb the randomness inside a range.
Stops should respect the logic of the setup. Range trades generally fail when price breaks and holds beyond a boundary. Breakout trades generally fail when price returns and accepts back inside the range.
Targets should match realistic movement. If the range height is small, expecting a large trend-like payoff inside it is rarely justified. Conversely, when trading breakouts, it helps to think in terms of the range height as a potential measured move, while staying flexible because markets do not move in perfect geometry.
Most importantly, a trader should know before entering what would prove the idea wrong. Consolidation punishes vague thinking.
Common mistakes traders make with consolidation
Many losses come from treating consolidation like a trend. Trend-following techniques often produce whipsaws when price repeatedly crosses levels without follow-through.
Another common error is ignoring higher-timeframe context. A small range against a strong higher-timeframe trend can break sharply in the trend direction. A range at a major multi-month level can turn into a distribution zone and reverse. The same shape can behave differently depending on where it forms.
Chasing the first breakout is another classic trap. A single spike beyond a boundary is not always a real break. Waiting for a close, a retest, or clear acceptance often improves quality, even if it means missing some moves.
Finally, traders sometimes forget that consolidation is not a promise of a big breakout. Volatility can compress and then expand only modestly, or price can drift into a new range. Expectations should remain probabilistic, not absolute.
Conclusion
Price consolidation is a fundamental market phase that bridges trends, reversals, and volatility expansion. It reflects balance and uncertainty rather than inactivity.
By learning to recognise consolidation, map its boundaries, and choose appropriate strategies – whether that means disciplined range trading, patient breakout planning, or standing aside – traders can improve structure, reduce unnecessary risk, and make more informed decisions across a wide range of trading instruments.
Consolidation is not the absence of opportunity. It is the market preparing for what comes next.
Go Back Go Back
