In the world of technical analysis, few reversal patterns hold as much strategic weight as the double bottom. While often covered in beginner materials, experienced traders know that spotting a true double bottom in live markets—and acting on it with precision—requires more than textbook theory. This pattern, when confirmed and integrated with contextual analysis, can signal powerful trend reversals and provide high-reward setups across asset classes.
This article revisits the double bottom pattern from an advanced perspective, examining structural nuances, trade setups and measured targets.
Anatomy of a Double Bottom
At its core, a double bottom is a bullish reversal pattern that forms after a sustained downtrend. It appears as a "W" shape on the chart—two consecutive troughs of roughly equal depth, separated by a peak (the neckline).
Key Pattern Criteria
- Preceding Downtrend: A valid double bottom must be preceded by a clear bearish trend, ideally with strong momentum.
- Symmetrical Lows: The two lows should occur at similar price levels. Small deviations are acceptable but large asymmetry reduces reliability.
- Time Spacing: The two bottoms are typically separated by days or weeks on higher timeframes. Too close, and it becomes a potential noise; too far, and the context may shift.
- Neckline Formation: The high between the two troughs forms a horizontal or slightly downward-sloping resistance level—known as the neckline. A confirmed breakout above this level is what validates the pattern.
Confirmation Matters
A double bottom is only complete when the price breaks and closes above the neckline. Ideally, this breakout is accompanied by increased volume or momentum, adding conviction to the reversal.
Advanced Considerations and Pitfalls
Experienced traders understand that not all W-shaped patterns are actionable double bottoms. Here are some of the advanced elements to watch for:
1. False Breakouts
One of the most common traps is a premature breakout above the neckline that quickly reverses. These "bull traps" often lure traders before the pattern is fully confirmed.
Pro tip: Wait for a strong candle close above the neckline, ideally with volume confirmation or supporting oscillator signals (e.g., RSI divergence or MACD crossover).
2. Retests and Role Reversal
Many traders prefer to enter on a pullback to the neckline (now potential support) after the breakout. This conservative approach may miss some early moves but offers more favorable risk-reward and filters out false signals.
3. Timing Between Bottoms
If the second trough forms too quickly, it may signal a weak reaction. Patterns with a healthy spacing—such as 5 to 20 trading days between bottoms—tend to perform better.
4. Volume Dynamics
Ideally, volume decreases during the second bottom and increases on the breakout. This indicates selling pressure is exhausted and buying interest is growing.
5. Divergence Signals
If the second bottom occurs with higher RSI or MACD readings compared to the first, it often confirms weakening bearish momentum.
Setting Targets: The Measured Move Method
To estimate price targets after a breakout:
- Measure the height of the pattern: the distance from the lowest trough to the neckline.
- Project this distance upward from the breakout point above the neckline.
For example:
- Trough: 1.2500
- Neckline: 1.2700
- Height: 200 pips
- Breakout point: 1.2710
- Target: 1.2910
This simple projection often aligns with short- to medium-term price extensions. However, traders can also apply Fibonacci extensions or volume profile tools for dynamic targets.
Stop Placement
Stops are commonly placed:
- Just below the second bottom for aggressive entries.
- Below the neckline on a pullback entry.
- Using ATR-based volatility buffers for advanced management.
Real-World Examples: July 2025
To bring theory into practice, let’s look at two verified double bottom formations that appeared in live markets during July 2025.
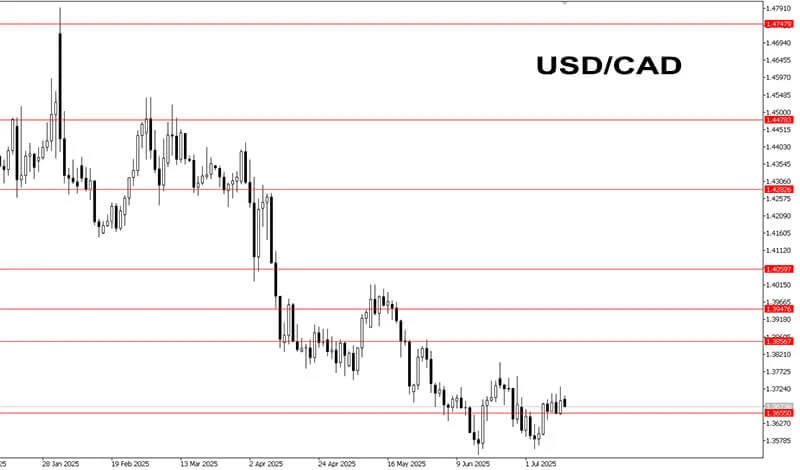
1. USD/CAD (Daily Chart)
- First bottom: June 16 at ~1.3550
- Second bottom: July 3 at ~1.3565
- Neckline: 1.3655
- Breakout: July 7
Context: This double bottom formed after a prolonged downtrend and was confirmed with a breakout above 1.3655. While the target of 1.3760 has not yet been reached, bullish momentum remains intact. Traders watching this setup may continue to trail stops or manage positions dynamically based on price action near the target zone.
Not a trading advice.
2. NZD/JPY (H4 Chart)
- Bottoms: Formed on July 2 and July 7 around 87.080
- Neckline: 88.600
- Breakout: July 7
- Result: Price surged to 88.130 by July 8
Context: The pattern coincided with dovish RBNZ commentary and an uptick in Japanese bond yields. Momentum confirmation from RSI divergence and bullish engulfing candle added strength.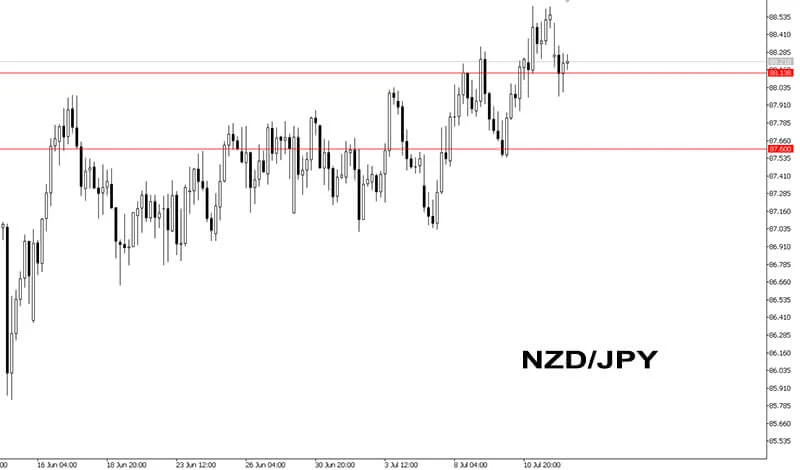
These examples illustrate how experienced traders can combine pattern recognition with broader macro or sentiment cues to execute high-conviction trades.
Strategy Integration for Experienced Traders
Double bottoms should not be viewed in isolation. Advanced traders typically combine them with other tools and contextual frameworks:
- Volume Profile Zones: Use to validate neckline levels.
- Order Flow Data: Check if buy-side pressure supports breakout.
- News Catalysts: Is the reversal supported by a shift in fundamentals?
- Multi-Timeframe Analysis: Confirm the pattern on daily, but refine entries on H4 or H1.
Risk management is paramount. Even high-probability double bottoms fail in volatile markets or during unexpected events. Proper position sizing and predefined exits are key.
Conclusion
The double bottom is a high-potential, deceptively simple pattern. For experienced traders, its real value lies in correct identification, strategic timing, and proper context.
Used effectively, it offers a powerful lens for spotting bullish reversals and crafting well-structured trades. As July 2025 has shown, this pattern remains as relevant and actionable as ever—whether in forex, crypto, or stocks.
Stay alert for the W with NordFX!
Go Back Go Back
