Moving averages are among the most widely used tools in technical analysis, and their popularity is easy to explain. They help traders reduce visual noise, identify directional bias, and bring structure to decisions that might otherwise be driven by emotion. Moving averages do not “predict” price. They summarise what price has already done, smoothing out short-term fluctuations so you can judge trend, momentum and the quality of a move more clearly.
This matters because markets spend a lot of time doing nothing dramatic, then move quickly when conditions change. In those transitions, traders often overreact. A moving average can keep you anchored to the bigger picture, provided you understand what it measures and what it cannot do. Used properly, it becomes a framework for trend-following, pullback entries and trade management. Used carelessly, it becomes a machine for late entries and whipsaws.
What a moving average actually measures
A moving average is a rolling calculation of average price over a selected number of periods. Each time a new candle closes, the indicator recalculates: the newest data point is added and the oldest is removed. That rolling window “moves” forward, producing a smooth line that reacts more slowly than price itself.
This delay is not a defect. It is the reason moving averages exist. Price is the raw signal; a moving average is a filtered version of that signal. Filtering reduces noise but introduces lag. That is why moving averages are often called lagging indicators: they confirm what has already started rather than anticipating what is about to happen.
The practical implication is simple. Moving averages tend to perform best when the market trends and tend to disappoint when the market ranges. If you try to force them into sideways conditions, you will often see price crossing the line repeatedly and generating false confidence.
SMA vs EMA: the difference that matters in practice
The two most common types are the Simple Moving Average (SMA) and the Exponential Moving Average (EMA). Both smooth price; they just do it differently.
Simple Moving Average (SMA) gives equal weight to every period in the lookback window. A 50-period SMA treats the most recent candle and the candle from 49 periods ago as equally important. This typically creates a smoother line, which many traders like for identifying overall structure.
Exponential Moving Average (EMA) weights recent prices more heavily, so it responds faster to changes in momentum. In fast markets, an EMA tends to track price more closely. That responsiveness can improve timing, but it can also increase whipsaws in choppy conditions because the line reacts more quickly to short-term swings.
A useful way to think about it is that SMA often works better for structure, EMA often works better for timing. Many traders combine them, using a slower average to define trend direction and a faster one to help with entries.
Choosing periods and timeframes without overthinking
A moving average period is not a magic number. It is a lens. The right setting depends on what you are trying to capture and how long you intend to hold trades.
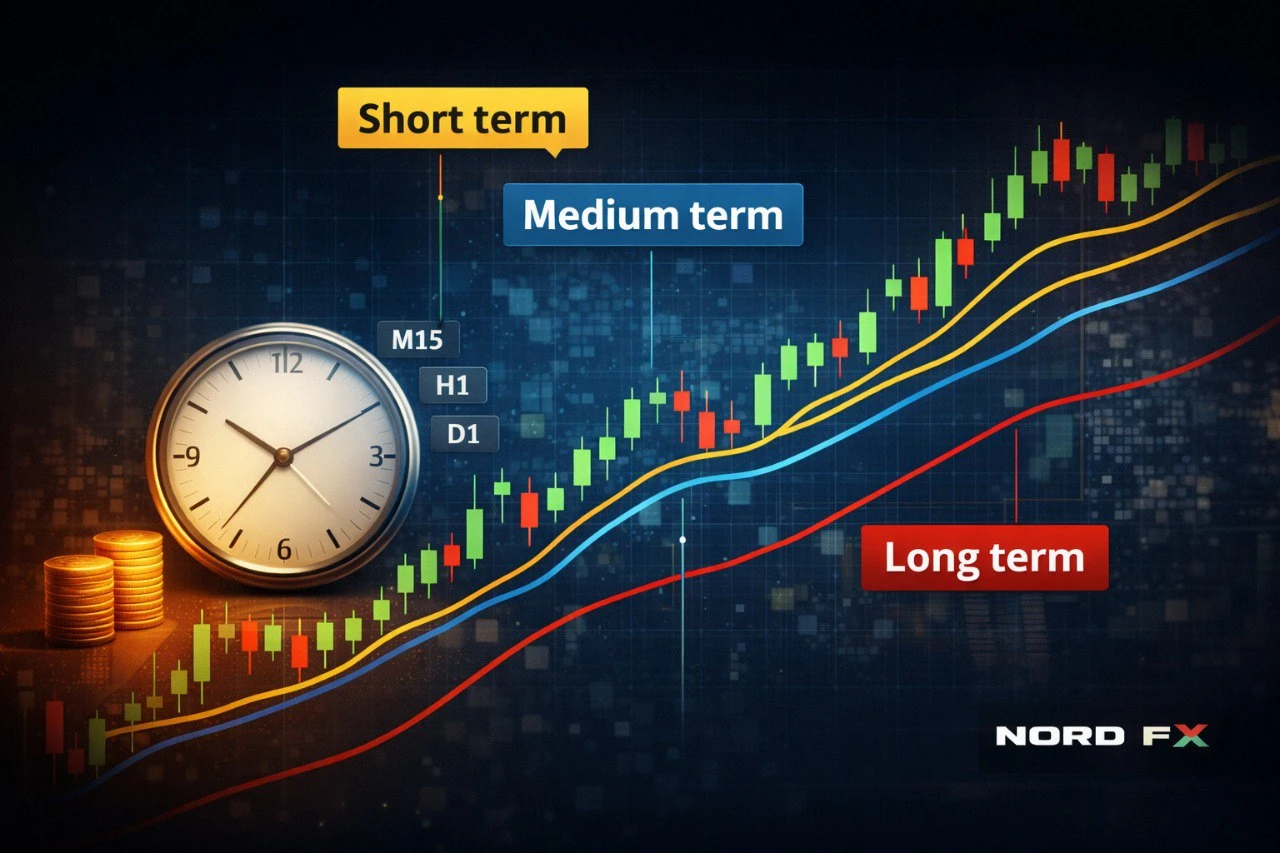
Short periods such as 10, 20 or 21 respond quickly and highlight short-term momentum. They can be helpful for active traders, but they are more vulnerable to false signals in ranging conditions. Medium periods such as 50 or 100 are commonly used as trend references on intraday and swing timeframes. Longer periods such as 200 are used to gauge broader market bias and can act as a widely watched reference point, especially on daily charts.
Timeframe changes everything. A 50-period moving average on M15 is describing a few hours of activity; a 50-period moving average on the daily chart is describing roughly ten trading weeks. If your strategy is swing-based, a moving average on the daily or H4 chart often provides a more stable foundation than one on very low timeframes.
The goal is not to find the “perfect” moving average. The goal is to find a repeatable method that matches your timeframe and remains consistent across market conditions.
The three core ways traders use moving averages
Moving averages are versatile because they can play different roles depending on the rules you attach to them.
Trend filter. This is the simplest and often the most effective use. When price holds above a rising moving average, conditions are generally bullish; when price holds below a falling moving average, conditions are generally bearish. The slope matters. A flat moving average often indicates consolidation rather than trend.
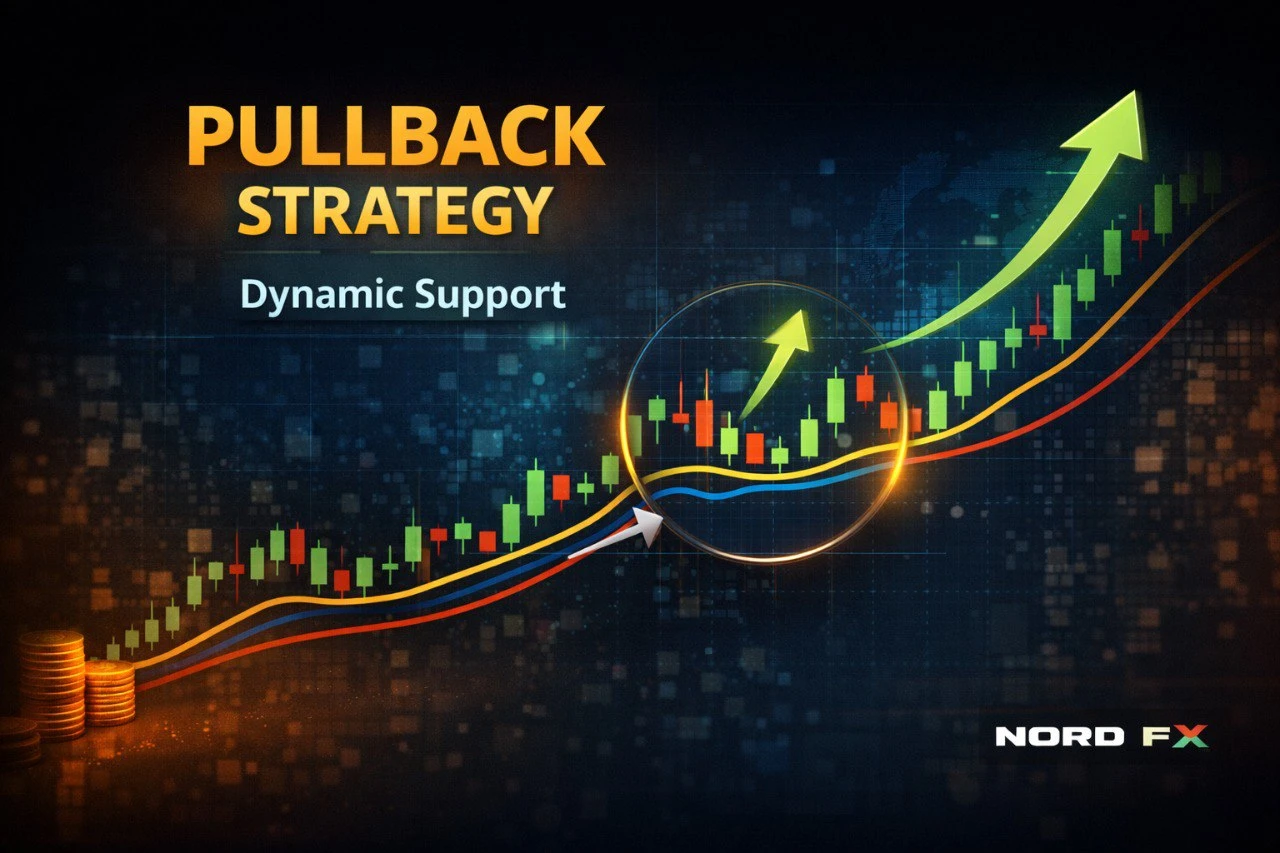
Dynamic support and resistance. In clean trends, price often pulls back towards a moving average and then continues in the original direction. Traders treat the moving average area as a zone where demand or supply may re-enter. This tends to work best when the trend is strong and orderly. In messy conditions, price crosses the line repeatedly and the concept breaks down.
Trend health and momentum. The slope of the moving average and the distance between price and the line can offer clues about trend strength. A steep slope with price holding above the average can signal strong momentum; a flattening slope after a long run can suggest the trend is losing energy and may transition into a range.
Crossovers: popular, simple, and often misunderstood
The moving average crossover is a classic method. It uses a faster moving average and a slower moving average. When the fast line crosses above the slow line, it is treated as bullish; when it crosses below, bearish.
Crossovers can work during sustained trends, but they are notorious for producing false signals in sideways markets. When price chops back and forth, the averages “tangle” and cross repeatedly. Traders then feel as if the indicator is failing, when the real issue is that the market regime is not suited to a trend-following tool.
Crossovers become more useful when you add context. Many traders filter crossover signals by requiring the slower moving average to be clearly sloping in the trade direction. Others check higher-timeframe structure first, so they are not taking a fresh crossover directly into a major support or resistance area.
A practical pullback approach with moving averages
Pullbacks are often more robust than crossovers because they aim to enter with the trend after a retracement rather than chasing a late signal.
A typical moving-average pullback framework has three parts. First, identify trend direction using a slower moving average and the overall swing structure. Second, wait for price to retrace towards the moving average zone without breaking the broader trend. Third, look for evidence that price is resuming the main direction, such as a clear rejection of the pullback zone or a break of a minor swing point.
The key is to treat a moving average as a zone, not a razor-thin level. Markets are not precise. Price can briefly dip through a moving average and still be trending, especially in volatile instruments. The question is whether the retracement changes structure and whether momentum returns in the trend direction.
Moving averages and risk management
Moving averages can support trade management, but they should never replace proper risk rules. Some traders place a stop beyond the moving average zone on pullback entries, reasoning that if price decisively breaks through and holds on the other side, trend conditions have weakened. This can make sense, but only if the stop also respects market structure and typical volatility.
This is where execution factors matter. Spread, market execution and margin can affect how trades behave, especially around fast moves. If you want a solid refresher on these mechanics, it is worth reading NordFX’s guide on how trading works, including how pricing and execution function in practice.
Position sizing remains the most important part of risk management. Even a good moving average setup can fail. Risk rules ensure that a failed setup is a controlled loss, not a damaging event.
Why moving averages “fail” for many traders
Moving averages are often blamed for problems caused by inconsistent application. One common issue is over-optimisation, where traders tweak periods until past performance looks perfect. That kind of tuning usually collapses in live markets because it fits historical noise rather than durable behaviour.
Another issue is ignoring market regime. Moving averages thrive in trends and suffer in ranges. If you take every signal regardless of conditions, you will experience repeated whipsaws as a normal cost of doing business. A simple regime filter, even something as basic as requiring the moving average to have a clear slope, can improve decision quality.
Finally, many traders use only one timeframe. A setup that looks attractive on M15 may be trading directly into a daily resistance zone. The indicator did not mislead you; the missing context did.
Applying moving averages on MT4/MT5 with a clean workflow
Most traders apply moving averages directly on platform charts. The mechanics are straightforward, but the workflow matters. You want a chart layout that remains readable and supports repeatable decisions. Overloading charts with too many averages often creates confusion and encourages subjective interpretation.
If you trade on MetaTrader, you can build a simple and effective layout using NordFX’s trading platforms page as a starting point for platform access and features, then keep your chart template consistent across instruments.
A practical approach is to define trend with a longer moving average and use a shorter one for timing, while keeping the rest of the chart uncluttered so price action remains the main focus.
Moving averages across forex, indices, metals and crypto
The logic of moving averages applies across markets because it is based on price behaviour, not on the underlying asset. Still, different instruments have different volatility profiles and trading hours, which changes how moving average zones behave.
Forex majors often alternate between trending phases and long consolidations, which makes regime awareness essential. Indices can trend smoothly but react sharply around major macro events. Metals can overshoot moving averages during risk-driven bursts. Crypto trades continuously and can move fast, often producing deeper pullbacks and sharper reversals, so moving averages should be treated as flexible zones rather than exact triggers.
Whatever the instrument, the same principle holds. Moving averages provide structure. Your edge comes from context, risk management and consistent execution.
Conclusion: the realistic value of moving averages
Moving averages are not shortcuts. They are tools for clarity. They can help you identify trend direction, avoid emotional overreaction to noise, and build a repeatable framework for entries and trade management. They cannot protect you from poor risk discipline or from trading the wrong market regime.
If you want to practise moving average methods, account type and trading conditions matter, especially spreads and execution. You can review NordFX options on the trading accounts page, then choose a setup that suits your strategy and timeframe.
When you are ready to apply these concepts in practice, you can start via the NordFX registration page and build a consistent workflow around a small set of rules rather than chasing perfect indicator settings.
Disclaimer: This material is for informational purposes only and does not constitute investment advice. Trading on financial markets involves risk and can result in loss of funds.
Go Back Go Back
