Supply and demand zones are price areas on a chart where strong buying or selling previously occurred, causing a sharp move away from that level. In supply and demand zones, traders expect similar reactions in the future because unfilled orders or strong market interest may still exist at those prices.
Supply and demand zones are one of the most widely used concepts in technical trading because they focus directly on price behavior rather than indicators. Traders use these zones to identify areas where buying or selling pressure previously caused strong market reactions. Understanding how supply and demand zones work can help traders make clearer decisions about entries, exits, and risk control across different markets.
Supply and demand zones are relevant in forex, indices, commodities, and cryptocurrencies. They are especially useful for traders who want to understand why price moves, not just where it moves.
Key points:
- Supply zones represent areas of heavy selling pressure.
- Demand zones represent areas of strong buying pressure.
- Zones are areas, not exact price levels.
- They can be used across all liquid markets.
- Risk management is essential when trading zones.
What Are Supply and Demand Zones in Trading?
Supply and demand zones in trading are price areas where the balance between buyers and sellers shifted strongly in the past. When demand exceeded supply, price moved up aggressively, forming a demand zone. When supply exceeded demand, price dropped sharply, creating a supply zone.
Unlike traditional support and resistance, supply and demand zones focus on institutional activity. Large market participants often place orders in clusters, not at a single price. These clusters create zones where price is likely to react again when revisited.
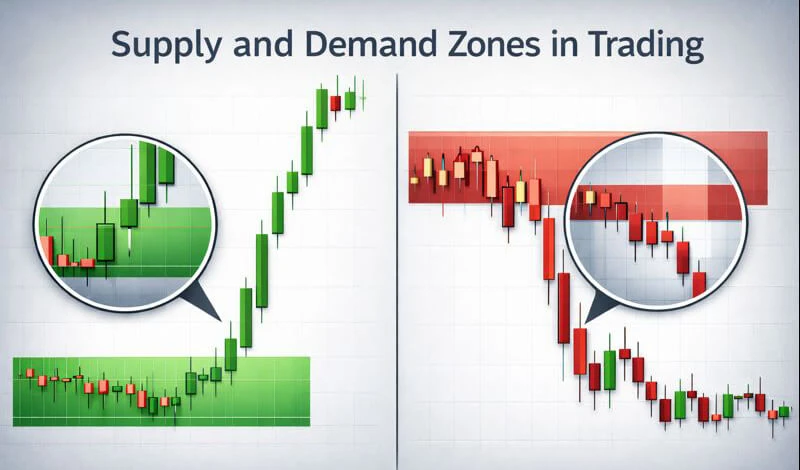
A demand zone typically forms before a strong upward move. It represents an area where buyers were willing to absorb selling pressure and push price higher. A supply zone forms before a strong downward move, showing where sellers overwhelmed buyers.
Traders use these zones to anticipate potential reversals, pullbacks, or pauses in price movement. However, zones do not guarantee reversals. They indicate areas of interest where traders should observe price behavior carefully.
Structure of Supply and Demand Zones
The structure of supply and demand zones is based on how price consolidates before making an impulsive move. Most zones consist of three parts:
- The move into the zone
- The base
- The move away from the zone
The base is the most important part of the zone. It is where price pauses, moves sideways, or forms small candles before breaking out strongly. This consolidation suggests order accumulation or distribution.
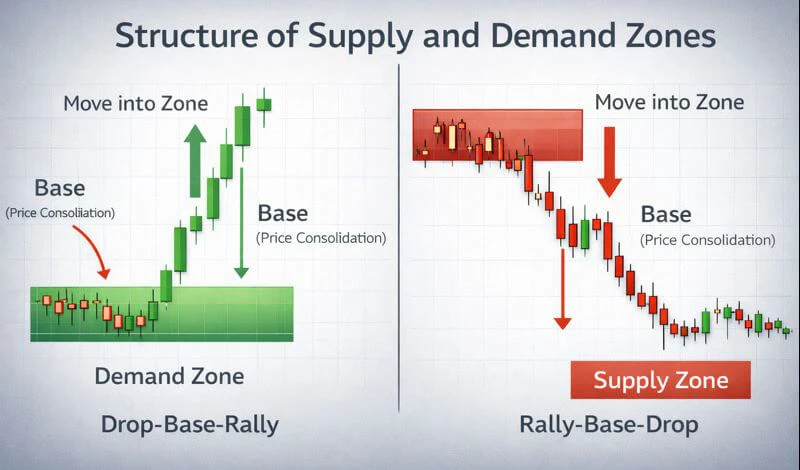
Demand zones often appear as rally-base-rally or drop-base-rally patterns. Supply zones usually appear as drop-base-drop or rally-base-drop patterns. The sharper and more aggressive the move away from the base, the stronger the zone is considered.
The width of the zone matters. Very wide zones may indicate uncertainty, while very narrow zones may not capture enough market activity. Traders usually draw zones from the extreme wick to the body area where price consolidated.
How Supply and Demand Zones Work
Supply and demand zones work because of market psychology and order flow. When price leaves a zone quickly, it means that one side of the market was significantly stronger. Often, not all orders are filled during the initial move.
When price later returns to the zone, remaining buy or sell orders may still be waiting. This can cause price to react again, either reversing or slowing down. Traders look for confirmation such as rejection wicks, momentum shifts, or lower timeframe patterns when price re-enters a zone.
Zones can also change roles. A broken demand zone may become a future supply zone, and a broken supply zone may become future demand. This happens when market structure shifts and previous buyers turn into sellers, or vice versa.
Supply and demand zones are not predictive on their own. They provide context. Traders still need to assess trend direction, volatility, and overall market conditions.
Best Timeframe Selection for Supply and Demand Zones
The best timeframe for supply and demand zones depends on the trader’s style and objectives. Higher timeframes such as daily and four-hour charts usually produce stronger and more reliable zones because they reflect institutional activity.
Lower timeframes like five-minute or fifteen-minute charts can also be used, but zones formed there are more sensitive to noise. Short-term traders often align lower timeframe entries with higher timeframe zones to improve accuracy.
A common approach is to mark zones on the higher timeframe and then drop to a lower timeframe for entries. This helps traders see the broader market context while fine-tuning risk and reward.
Timeframe alignment is important. A demand zone on a five-minute chart that sits inside a higher timeframe supply zone has a lower probability of holding. Always consider where the zone sits within the overall market structure.
Step-by-step guide to drawing zones
Drawing supply and demand zones is a structured process that improves with practice.
- The first step is identifying a strong impulsive move. Look for areas where price moved rapidly with large candles and minimal pullbacks.
- Next, locate the base just before that move. This is the consolidation area where price paused briefly. The base is usually marked by small-bodied candles, dojis, or tight ranges.
- Then define the zone boundaries. For a demand zone, draw from the lowest wick of the base to the highest close within the base. For a supply zone, draw from the highest wick of the base to the lowest close.
- Finally, extend the zone forward on the chart. Observe how price behaves when it returns. Avoid adjusting zones repeatedly, as this introduces subjectivity and inconsistency.
Top Mistakes to Avoid while trading Supply and Demand Zones
One common mistake is drawing too many zones. Overloading a chart with zones reduces clarity and leads to indecision. Traders should focus on the most obvious and strongest zones.
Another mistake is ignoring trend direction. Trading against a strong trend simply because price reached a zone often leads to losses. Zones work best when aligned with the broader trend or market structure.
Many traders also treat zones as exact levels. Supply and demand zones are areas, not precise prices. Expecting price to reverse at a single point leads to premature entries and tight stop losses.
Finally, failing to manage risk is a critical error. Even the best zones fail. Proper position sizing and stop placement are essential for long-term consistency.
Technical Tools for Zone Analysis
Technical tools can enhance supply and demand zone analysis when used correctly. Volume indicators help confirm whether strong participation accompanied the move away from a zone. Higher volume adds credibility to the zone.
Moving averages can help identify trend direction and filter zones that go against the dominant flow. Trendlines and market structure analysis provide additional context for zone strength.
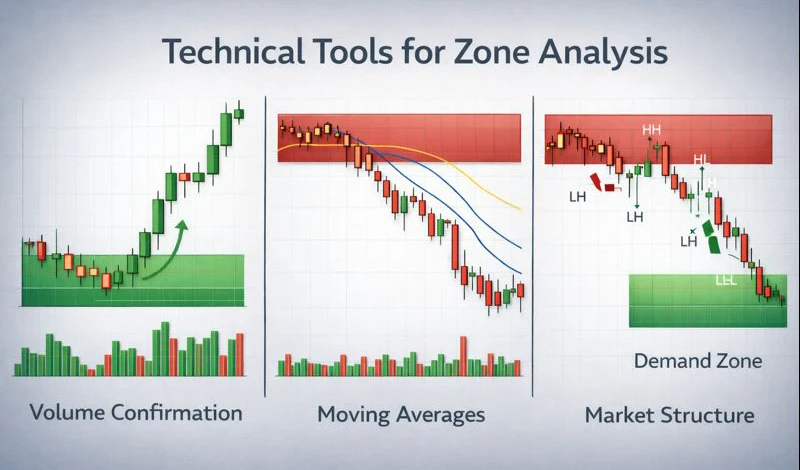
Oscillators such as RSI or stochastic can help identify overbought or oversold conditions when price enters a zone. However, indicators should support zone analysis, not replace it. Supply and demand zones remain a price-based concept.
What is the theory behind supply and demand zones?
The theory behind supply and demand zones comes from basic economics. Price moves based on the imbalance between supply and demand. When demand exceeds supply, prices rise. When supply exceeds demand, prices fall.
In financial markets, large participants such as banks and institutions cannot enter all positions at once without moving the market. They often accumulate or distribute positions over time, creating zones.
These zones represent areas where the market previously found value. When price returns, the same valuation logic may apply, leading to renewed interest. This is why zones can remain relevant long after they first form.
The theory also explains why zones eventually fail. Once orders are fully absorbed or market sentiment changes, price moves through the zone and searches for a new balance.
Advantages of Using Supply and Demand Zones
One advantage of supply and demand zones is clarity. They help traders focus on meaningful price areas rather than reacting to every small fluctuation.
Zones are adaptable across markets and timeframes. The same principles apply whether trading forex pairs, indices, or cryptocurrencies. They also integrate well with other forms of analysis.
Supply and demand zones encourage disciplined trading. By defining areas of interest in advance, traders can plan entries, stops, and targets more objectively.
Another advantage is risk-to-reward potential. Well-defined zones often allow for relatively small stop losses compared to potential upside or downside.
Limitations of Supply and Demand Zones
Despite their usefulness, supply and demand zones have limitations. Drawing zones involves subjectivity, especially for beginners. Different traders may draw slightly different zones on the same chart.
Zones also do not work in isolation. News events, macroeconomic shifts, and sudden liquidity changes can invalidate zones quickly. Traders must stay aware of broader market drivers.
False reactions are another limitation. Price may briefly react at a zone and then continue through it. This can lead to premature exits or losses if traders rely solely on zones without confirmation.
Understanding these limitations helps traders trade supply and demand zones more realistically and responsibly.
Optimizing Your Trading with Demand and Supply Zone Strategies
Optimizing trading with supply and demand zone strategies involves combining zones with structure, confirmation, and risk control. One common approach is waiting for price action confirmation inside the zone, such as rejection candles or lower timeframe structure shifts.
Another strategy is using zones for trade management rather than entries. Traders may enter trades elsewhere but use zones as target areas or trailing stop reference points.
Risk management remains central. Stops should be placed beyond the zone, not inside it, to allow for normal price fluctuation. Position sizing should reflect the distance to the stop.
To deepen understanding, traders can explore educational resources such as NordFX forex education section, trading platforms overview, and risk management guide.
FAQs
Are supply and demand zones better than support and resistance?
Supply and demand zones are not necessarily better, but they offer a different perspective. They focus on order flow and institutional activity rather than repeated price reactions at a single level. Many traders use both concepts together for stronger analysis.
Do supply and demand zones work in all markets?
Yes, supply and demand zones can be applied to forex, indices, commodities, and cryptocurrencies. They tend to work best in liquid markets where large participants are active and price moves are driven by real order flow.
How many times can a zone be traded?
Each time a zone is tested, its strength usually decreases. The first and second tests are often considered more reliable than later ones. After multiple tests, the zone may lose significance.
Should beginners trade supply and demand zones?
Beginners can learn supply and demand zones, but they should practice on higher timeframes first. Higher timeframes reduce noise and make zone structure easier to identify. Demo trading is recommended during the learning phase.
Can supply and demand zones fail?
Yes, zones fail when market conditions change or when all orders in the zone are filled. This is normal and expected. Proper risk management is essential to handle failed zones.
What confirmation works best with supply and demand zones?
Price action confirmation such as rejection wicks, engulfing candles, or lower timeframe structure breaks works well. Indicators can support confirmation but should not replace price-based analysis.
How wide should a supply or demand zone be?
The width should cover the base where price consolidated before the strong move. Zones that are too wide may be less precise, while zones that are too narrow may not reflect true market activity.

